Apparently they are running a story on the Venter Global Ocean Survey project on the NewsHour tonight
Not sure exactly what they are saying but good that it has made it to my favorite news show.

Apparently they are running a story on the Venter Global Ocean Survey project on the NewsHour tonight
Not sure exactly what they are saying but good that it has made it to my favorite news show.
I am posting here my first Open Access article, from Genome Biology in 2000.
Research
Evidence for symmetric chromosomal inversions around the replication origin in bacteria
Jonathan A Eisen  , John F Heidelberg, Owen White and Steven L Salzberg
The Institute for Genomic Research, 9712 Medical Center Drive, Rockville, MD 20850, USA
Genome Biology 2000, 1:research0011.1-0011.9 doi:10.1186/gb-2000-1-6-research0011
Subject areas: Genome studies, Microbiology and parasitology, Evolution
The electronic version of this article is the complete one and can be found online at: http://genomebiology.com/2000/1/6/research/0011
Received
7 August 2000
Revisions received
25 September 2000
Accepted
19 October 2000
Published
4 December 2000
© 2000 GenomeBiology.com
Outline
Abstract
Background
Whole-genome comparisons can provide great insight into many aspects of biology. Until recently, however, comparisons were mainly possible only between distantly related species. Complete genome sequences are now becoming available from multiple sets of closely related strains or species.
Results
By comparing the recently completed genome sequences of Vibrio cholerae, Streptococcus pneumoniae and Mycobacterium tuberculosis to those of closely related species – Escherichia coli, Streptococcus pyogenes and Mycobacterium leprae, respectively – we have identified an unusual and previously unobserved feature of bacterial genome structure. Scatterplots of the conserved sequences (both DNA and protein) between each pair of species produce a distinct X-shaped pattern, which we call an X-alignment. The key feature of these alignments is that they have symmetry around the replication origin and terminus; that is, the distance of a particular conserved feature (DNA or protein) from the replication origin (or terminus) is conserved between closely related pairs of species. Statistically significant X-alignments are also found within some genomes, indicating that there is symmetry about the replication origin for paralogous features as well.
Conclusions
The most likely mechanism of generation of X-alignments involves large chromosomal inversions that reverse the genomic sequence symmetrically around the origin of replication. The finding of these X-alignments between many pairs of species suggests that chromosomal inversions around the origin are a common feature of bacterial genome evolution.
Outline
Background
Large-scale genomic rearrangements and duplications are important in the evolution of species. Previously, these large-scale genome-changing events were studied through genetic or cytological studies. With the availability of many complete genome sequences it is now possible to study such events through comparative genomics. The publication of the yeast genome has led to much better insight into the duplication events that have occurred in fungal and eukaryotic evolution (for example, see [1]). Large chromosomal duplications have also been found from analysis of completed chromosomes of Arabidopsis thaliana [2,3]. The ability to detect large-scale genomic changes is dependent in large part on which genomes are available. Such studies in bacteria, for example, have been limited by the availability of genomes only from distantly related sets of species. Recently, however, the genomes of sets of closely related bacterial species have become available. We have compared these closely related bacterial genomes and have discovered an unusual phenomenon – alignments of whole genomes that show an X-shaped pattern (which we refer to as X-alignments). Here we present the evidence for these X-alignments and discuss mechanisms that might have produced them.
Outline
Results and discussion
Figures
Between-species whole-genome DNA alignments
Whole-genome proteome alignments
Within-genome DNA alignments
Schematic model of genome inversions
Tables
Whole-genome DNA alignments using MUMmer
Whole-genome protein-level comparisons
Whole-genome X-alignments between species at the DNA level
We compared the DNA sequences of the two chromosomes of Vibrio cholerae [4] with the sequence of the Escherichia coli chromosome [5] using a suffix tree alignment algorithm [6]. The analysis revealed a significant alignment at the DNA level between the V. cholerae large chromosome (chrI) [4] and the E. coli chromosome [5] spanning the entire length of these chromosomes (Figure 1a). Analysis of the reverse complement of V. cholerae chrI with E. coli also produced a significant alignment (Figure 1b). When superimposed, the two alignments produce a clear ‘X’ shape (Figure 1c) that is symmetric about the origin of replication of both genomes. This symmetry indicates that matching sequences tend to occur at the same distance from the origin but not necessarily on the same side of the origin. The X-alignment between V. cholerae and E. coli was found to be statistically significant using a test based on the number of matches found in diagonal strips in the alignment (see the Materials and methods section). Specifically, when V. cholerae chrI is aligned in the forward direction against E. coli, there are 459 maximal unique matching subsequences (MUMs; see the Materials and methods section), of which 177 occurred in a diagonal strip covering 10% of the total area (compared to the expected value of 46). The probability of observing this high a number of MUMs by chance is 4.7 × 10-59. The alignment of V. cholerae chrI in the reverse direction against E. coli (which corresponds to the MUMs on the anti-diagonal) has a probability of 1.8 × 10-90. As a control, we compared the genomes of distantly related species, such as E. coli and Mycobacterium tuberculosis. These do not show a significant X-alignment (Table 1).
We have found that X-alignments of whole genomes are not limited to the V. cholerae versus E. coli comparison. For example, a whole-genome comparison of two bacteria in the genus Streptococcus – S. pyogenes [7] and S. pneumoniae (H. Tettelin, personal communication) – reveals a global X-alignment similar to that of V. cholerae versus E. coli (Figure 1d) which is also statistically significant (Table 1). In addition, an X-alignment is found between two species in the genus Mycobacterium – M. tuberculosis [8] and M. leprae [9] (Figure 1e) – as well as between two strains of Helicobacter pylori (data not shown). The X-alignments observed between any two pairs of genomes are not identical in every aspect. For example, in the alignment between the two Mycobacterium species, each conserved region is much longer than in the other genome pairs. We believe this is due to different numbers of evolutionary events between the species (see below). Whole-genome X-alignments were not found between any other pairs of species, although a related pattern was seen between some of the chlamydial species (see below).
Whole-genome X-alignments between species are also found at the proteome level
To test whether the X-alignments found in the DNA analysis could also be found at the level of whole proteomes, we conducted comparisons of homologous proteins between species (see the Materials and methods section). Figure 2a shows a scatterplot of chromosome positions of all proteins homologous between V. cholerae chrI and E. coli. The presence of many large gene families causes a great deal of noise in this comparison. This noise can be reduced by considering only the best matching homolog for each open reading frame (ORF), rather than all protein homologs (Figure 2b). This filtered protein comparison results in an X-alignment that is statistically significant (Table 2).
Whole-genome X-alignments within species
The finding of the X-alignment pattern between species led us to search for similar patterns within species; that is, global alignments of a genome with its own reverse complement. Of the genomes for which we found between-species X-alignments (M. tuberculosis, M. leprae, S. pyogenes, S. pneumoniae, E. coli and V. cholerae), statistically significant self-alignments are detected for all except M. tuberculosis (Figure 3; probabilities shown in Table 1). Interestingly, these self-alignments are not as strong as those between species. Proteome analysis also shows an X-alignment within species (shown for V. cholerae chrI in Figure 2d; probabilities shown in Table 2). The X-alignment of proteins within V. cholerae chrI is statistically significant only for recently duplicated-genes, but disappears when all paralogs are included. The importance of filtering for recent duplications is discussed below.
Model I: whole-genome inverted duplications
One possible explanation for an X-alignment within and between species is an ancestral inverted duplication of the whole genome, as has been suggested for E. coli [10]. The weak or missing X-alignment within species could be explained by gene loss of one of the two duplicates of many of the pairs of genes in the different lineages. Gene loss has been found to follow large chromosomal or genome duplications [11,12,13]. This gene loss is thought to stabilize large duplications by preventing recombination events between duplicate genes. If gene loss is responsible for the weak X-alignment within species, then to maintain the X-alignments between species, the member of the gene pair lost in a particular lineage should be essentially random. If an ancient inverted duplication followed by differential gene loss is the correct explanation for the observed X-alignments, one would expect the genes along one diagonal to be orthologous between species (related to each other by the speciation event), while the genes along the other diagonal should be paralogous (related to each other by the genome duplication event before the speciation of the two lineages). However, the evidence appears to contradict this model: likely orthologous gene pairs are equally distributed on each diagonal (data not shown).
Model II: chromosomal inversions about the origin and/or terminus
A second possible explanation for the X-alignments is that an underlying mechanism allows sections of DNA to move within the genome but maintains the distance of these sections from the origin and/or terminus. There are a variety of possible mechanisms for such movement, but we believe the most likely explanation is the occurrence of large chromosomal inversions that pivot around the replication origin and/or terminus. Large chromosomal inversions, including those that occur around the replication origin and terminus, have been shown to occur in E. coli and Salmonella typhimurium in the laboratory (see, for example, [14,15,16,17,18]). The occurrence of such inversions over evolutionary time scales was first suggested by comparative analysis of the complete genomes of four strains in the genus Chlamydia [19]. In that study, we found that the major chromosomal differences between C. pneumoniae and C. trachomatis (shown in Figure 2c) were consistent with the occurrence of large inversions that pivoted around the origin and terminus (including multiple inversions of different sizes). In Figure 4 we present a hypothetical model showing how a small number of inversions centered around the origin or terminus could produce patterns very similar to those seen in the Chlamydia, Mycobacterium and Helicobacter comparisons. The continued occurrence of such inversion over longer time scales would result in an X-alignment similar to that seen in the V. cholerae versus E. coli and S. pneumoniae versus S. pyogenes comparisons. Thus the different between-species X-alignments could be the result of different numbers of inversions between particular pairs of species.
Inversions about the origin and terminus could also produce an X-alignment within species, through the splitting of tandemly duplicated sequence. Many sets of tandemly duplicated genes are found in most bacterial genomes [19,20] (also see Figure 3a,c). As tandem duplications are inherently unstable (one of the duplicates can be rapidly eliminated by slippage and/or recombination events [21]), the fact that many tandem pairs are present within each genome suggests that tandem duplications occur frequently. Thus, it is reasonable to assume that occasionally a large inversion will split a pair of tandemly duplicated genes. An inversion that pivots about the origin and also splits a tandem duplication will result in a pair of paralogous genes spaced symmetrically on opposite sides of the origin.
If our inversion model is correct, then the genes along both diagonals in the between-species alignments should be orthologous, which is the case (see above). In contrast, genes along the anti-diagonal in the within-species X-alignments should be recent tandem duplicates that have been separated by inversions. This also appears to be the case – in the within-species analysis of V. cholerae chrI ORFs, the X-alignment shows up best when only recent duplicates are analyzed (Figure 2d). The splitting of tandem duplicates by inversions may be a general mechanism to stabilize the coexistence of duplicated genes, as it will prevent their elimination by unequal crossing-over or replication slippage events.
What could cause inversions that pivot around the origin and terminus of the genome to occur more frequently than other inversions? One possibility is that many inversions occur, but there is selection against those that change the distance of a gene from the origin or terminus. Such a possibility has been suggested by experimental work in E. coli [14,15]. Additional studies have, however, suggested that there is little selective difference between inversions and that instead there may be certain regions that are more prone to inversion than others [16,17,18,22,23]. Alternatively, the inversion events could be linked to replication, as has been suggested for small local inversion events [24]. Whatever the mechanisms, the fact that we find evidence for such inversions between many pairs of species suggests that they are a common feature of bacterial evolution. Many aspects of the X-alignments require further exploration. For example, to split a tandem duplication, an inversion must fall precisely on the boundary between two duplicated genes. This would appear to be unlikely, requiring a large number of inversions in order to generate a sufficient number of split gene pairs. If the mechanisms of gene duplication are somehow related to the mechanisms of inversion, however, then this model is more plausible. The process of duplicating a gene, if it occurs during replication, might promote a recombination event within the bacterial chromosome that inverts the sequence from the origin up to that point. As with inversion events, recombination and replication have been found to be tightly coupled [25].
Conclusions
We present here a novel observation regarding the conservation between bacterial species of the distance of particular genes from the replication origin or terminus. The initial observation was only possible due to the availability of complete genome sequences from pairs of moderately closely related species (for example, V. cholerae and E. coli). This shows the importance of having genome pairs from many levels of evolutionary relatedness. Comparisons of distantly related species enable the determination of universal features of life as well as of events that occur very rarely. Comparison of very closely related species allows the identification of frequent events such as transitional changes at third codon positions or tandem duplications. To elucidate all other events in the history of life, genome pairs covering all the intermediate levels of evolutionary relatedness will be needed.
Outline
Materials and methods
Genomes analyzed
Complete published genome sequences were obtained from the National Center for Biotechnology Information website [26] or from the TIGR Comprehensive Microbial Resource [27]. These included Aeropyrum pernix [28], Aquifex aeolicus [29], Archaeoglobus fulgidus [30], Bacillus subtilis [31], Borrelia burgdorferi [32], Campylobacter jejuni [33], Chlamydia pneumoniae AR39 [19], Chlamydia pneumoniae CWL029 [34], Chlamydia trachomatis (D/UW-3/Cx) [35], Chlamydia trachomatis MoPn [19], Deinococcus radiodurans [36], Escherichia coli [5], Haemophilus influenzae [37], Helicobacter pylori [38], Helicobacter pylori J99 [39], Methanobacterium thermoautotrophicum [40], Methanococcus jannaschii [41], Mycobacterium tuberculosis [8], Mycoplasma genitalium [42], Mycoplasma pneumoniae [43], Neisseria meningitidis MC58 [20], Neisseria meningitidis serogroup A strain Z2491 [44], Pyrococcus horikoshii [45], Rickettsia prowazekii [46], Synechocystis sp. [47], Thermotoga maritima [48], Treponema pallidum [49], and Vibrio cholerae [4]. In addition, a few unpublished genomes were analyzed: Streptococcus pyogenes (obtained from the Oklahoma University Genome Center website [7]), Streptococcus pneumoniae (H. Tettelin, personal communication), and Mycobacterium leprae (obtained from the Sanger Centre Pathogen Sequencing Group website [9]).
Whole-genome DNA alignments
DNA alignments of the complete genomic sequences of all bacteria used in this study were accomplished with the MUMmer program [6]. This program uses an efficient suffix tree construction algorithm to rapidly compute alignments of entire genomes. The algorithm identifies all exact matches of nucleotide subsequences that are contained in both input sequences; these exact matches must be longer than a specified minimum length, which was set to 20 base pairs for this comparison. To search for genome-scale alignments within species, complete bacterial and archaeal genomes (25 in total including all published genomes) were aligned with their own reverse complements. To search for between-species alignments, all genomes were aligned against all others in both orientations.
Whole-genome protein comparisons
The predicted proteome of each complete genome sequence (all predicted proteins in the genome) was compared to the proteomes of all complete genome sequences (including itself) using the fasta3 program [50]. Matches with an expected score (e-value) of 10-5 or less were considered significant.
Statistical significance of X-alignments
To calculate the statistical significance of the X-alignments, the maximal unique matching subsequences (MUMs) for unrelated genomes were examined and found to be uniformly distributed [6]. With a uniform background, the expected density of MUMs in any region of an alignment plot is a simple proportion of the area of that region to the entire plot. In particular, in an alignment with N total MUMs, the probability (Pr) of observing at least m matches in a region with area p can be computed using the binomial distribution in Equation 1:

The alignment of V. cholerae chrI (both forward and reverse strands) versus E. coli contains 926 MUMs. The MUMs forming X-alignments appear along the diagonal (y = x) and the anti-diagonal (y = L -x, where L is the genome length). To estimate the significance of the alignments in both directions, diagonal strips were sampled along each of the diagonals. The width of each strip was set at 10% of the plot area and significance values were calculated (Table 1).
Identification of origins of replication
The origins of replication for the bacterial genomes have been characterized by a variety of methods. For E. coli, M. tuberculosis and M. leprae, the origins have been well-characterized by laboratory studies [51,52]. The origins and termini of C. trachomatis, C. pneumoniae and V. cholerae were identified by GC-skew [53] and by characteristic genes in the region of the origin [4,19]. GC-skew uses the function (G-C)/(G+C) computed on 2,000 bp windows across the genome, which exhibits a clear tendency in many bacterial genomes to be positive for the leading strand and negative for the lagging strand. The origin of H. pylori was determined by oligomer skew [54] and confirmed by GC-skew. The origins and termini of S. pneumoniae and S. pyogenes were determined by the authors of the present study using GC-skew analysis and the locations of characteristic genes, particularly the chromosome replication initiator gene dnaA.
Outline
Acknowledgements
We thank S. Eddy, M.A. Riley, T. Read, A. Stoltzfus, M-I Benito and I. Paulsen for helpful comments, suggestions and discussions. S.L.S. was supported in part by NSF grant IIS-9902923 and NIH grant R01 LM06845. S.L.S. and J.A.E were supported in part by NSF grant KDI-9980088. Data for all published complete genome sequences were obtained from the NCBI genomes database [26] or from The Institute for Genomic Research (TIGR) Microbial Genome Database [27]. The sequences of V. cholerae, S. pneumoniae, and M. tuberculosis (CDC 1551) were determined at TIGR with support from NIH and the NIAID. The M. leprae sequence data were produced by the Pathogen Sequencing Group at the Sanger Centre. Sequencing of M. leprae is funded by the Heiser Program for Research in Leprosy and Tuberculosis of The New York Community Trust and by L’Association Raoul Follereau. The M. tuberculosis CDC 1551 genome sequence was obtained from TIGR. The source of the S. pyogenes genome sequence was the Streptococcal Genome Sequencing Project funded by USPHS/NIH grant AI38406, and was kindly made available by B. A. Roe, S.P. Linn, L. Song, X. Yuan, S. Clifton, R.E. McLaughlin, M. McShan and J. Ferretti, and can be obtained from the website of the Oklahoma University Genome Center [7].
Outline
References
1.
Seoighe C, Wolfe KH: Updated map of duplicated regions in the yeast genome.
Gene 1999, 238:253-261. [PubMed Abstract] [Publisher Full Text]
Return to citation in text: [1]
2.
Lin X, Kaul S, Rounsley S, Shea TP, Benito MI, Town CD, Fujii CY, Mason T, Bowman CL, Barnstead M, et al.: Sequence and analysis of chromosome 2 of the plant Arabidopsis thaliana.
Nature 1999, 402:761-768. [PubMed Abstract] [Publisher Full Text]
Return to citation in text: [1]
3.
Mayer K, Schuller C, Wambutt R, Murphy G, Volckaert G, Pohl T, Dusterhoft A, Stiekema W, Entian KD, Terryn N, et al.: Sequence and analysis of chromosome 4 of the plant Arabidopsis thaliana.
Nature 1999, 402:769-777. [PubMed Abstract] [Publisher Full Text]
Return to citation in text: [1]
4.
Heidelberg JF, Eisen JA, Nelson WC, Clayton RA, Gwinn ML, Dodson RJ, Haft DH, Hickey EK, Peterson JD, Umayam L, et al.: The genome sequence of Vibrio cholerae, the aetiologic agent of cholera.
Nature 2000, 406:477-483. [PubMed Abstract] [Publisher Full Text]
Return to citation in text: [1] [2] [3] [4]
5.
Blattner FR, Plunkett GI, Bloch CA, Perna NT, Burland V, Riley M, Collado-Vides J, Glasner JD, Rode CK, Mayhew GF, et al.: The complete genome sequence of Escherichia coli K-12.
Science 1997, 277:1453-1462. [PubMed Abstract] [Publisher Full Text]
Return to citation in text: [1] [2] [3]
6.
Delcher AL, Kasif S, Fleischmann RD, Peterson J, White O, Salzberg SL: Alignment of whole genomes.
Nucleic Acids Res 1999, 27:2369-2376. [PubMed Abstract] [Publisher Full Text] [PubMed Central Full Text]
Return to citation in text: [1] [2] [3]
7.
Oklahoma University Genome Center [http://www.genome.ou.edu/strep.html]
Return to citation in text: [1] [2] [3]
8.
Cole ST, Brosch R, Parkhill J, Garnier T, Churcher C, Harris D, Gordon SV, Eiglmeier K, Gas S, Barry CE III, et al.: Deciphering the biology of Mycobacterium tuberculosis from the complete genome sequence.
Nature 1998, 393:537-544. [PubMed Abstract] [Publisher Full Text]
Return to citation in text: [1] [2]
9.
Sanger Centre Pathogen Sequencing Group [ftp://ftp.sanger.ac.uk/pub/pathogens/leprae]
Return to citation in text: [1] [2]
10.
Zipkas D, Riley M: Proposal concerning mechanism of evolution of the genome of Escherichia coli.
Proc Natl Acad Sci USA 1975, 72:1354-1358. [PubMed Abstract] [Publisher Full Text]
Return to citation in text: [1]
11.
Wagner A: The fate of duplicated genes: loss or new function?
BioEssays 1998, 20:785-788. [PubMed Abstract] [Publisher Full Text]
Return to citation in text: [1]
12.
Lynch M, Force A: The probability of duplicate gene preservation by subfunctionalization.
Genetics 2000, 154:459-473. [PubMed Abstract] [Publisher Full Text]
Return to citation in text: [1]
13.
Nadeau JH, Sankoff D: Comparable rates of gene loss and functional divergence after genome duplications early in vertebrate evolution.
Genetics 1997, 147:1259-1266. [PubMed Abstract] [Publisher Full Text]
Return to citation in text: [1]
14.
Francois V, Louarn J, Patte J, Rebollo JE, Louarn JM: Constraints in chromosomal inversions in Escherichia coli are not explained by replication pausing at inverted terminator-like sequences.
Mol Microbiol 1990, 4:537-542. [PubMed Abstract] [Publisher Full Text]
Return to citation in text: [1] [2]
15.
Rebollo JE, Francois V, Louarn JM: Detection and possible role of two large nondivisible zones on the Escherichia coli chromosome.
Proc Natl Acad Sci USA 1988, 85:9391-9395. [PubMed Abstract] [Publisher Full Text]
Return to citation in text: [1] [2]
16.
Segall A, Mahan MJ, Roth JR: Rearrangement of the bacterial chromosome: forbidden inversions.
Science 1988, 241:1314-1318. [PubMed Abstract] [Publisher Full Text]
Return to citation in text: [1] [2]
17.
Mahan MJ, Roth JR: Ability of a bacterial chromosome segment to invert is dictated by included material rather than flanking sequence.
Genetics 1991, 129:1021-1032. [PubMed Abstract] [Publisher Full Text]
Return to citation in text: [1] [2]
18.
Segall AM, Roth JR: Recombination between homologies in direct and inverse orientation in the chromosome of Salmonella : intervals which are nonpermissive for inversion formation.
Genetics 1989, 122:737-747. [PubMed Abstract] [Publisher Full Text]
Return to citation in text: [1] [2]
19.
Read TD, Brunham RC, Shen C, Gill SR, Heidelberg JF, White O, Hickey EK, Peterson J, Utterback T, Berry K, et al.: Genome sequences of Chlamydia trachomatis MoPn and Chlamydia pneumoniae AR39.
Nucleic Acids Res 2000, 28:1397-1406. [PubMed Abstract] [Publisher Full Text] [PubMed Central Full Text]
Return to citation in text: [1] [2] [3] [4] [5]
20.
Tettelin H, Saunders NJ, Heidelberg J, Jeffries AC, Nelson KE, Eisen JA, Ketchum KA, Hood DW, Peden JF, Dodson RJ, et al.: Complete genome sequence of Neisseria meningitidis serogroup B strain MC58.
Science 2000, 287:1809-1815. [PubMed Abstract] [Publisher Full Text]
Return to citation in text: [1] [2]
21.
Force A, Lynch M, Pickett FB, Amores A, Yan YL, Postlethwait J: Preservation of duplicate genes by complementary, degenerative mutations.
Genetics 1999, 151:1531-1545. [PubMed Abstract] [Publisher Full Text]
Return to citation in text: [1]
22.
Schmid MB, Roth JR: Selection and endpoint distribution of bacterial inversion mutations.
Genetics 1983, 105:539-557. [PubMed Abstract] [Publisher Full Text]
Return to citation in text: [1]
23.
Mahan MJ, Roth JR: Reciprocality of recombination events that rearrange the chromosome.
Genetics 1988, 120:23-35. [PubMed Abstract] [Publisher Full Text]
Return to citation in text: [1]
24.
Gordon AJ, Halliday JA: Inversions with deletions and duplications.
Genetics 1995, 140:411-414. [PubMed Abstract] [Publisher Full Text]
Return to citation in text: [1]
25.
Valencia-Morales E, Romero D: Recombination enhancement by replication (RER) in Rhizobium etli.
Genetics 2000, 154:971-983. [PubMed Abstract] [Publisher Full Text]
Return to citation in text: [1]
26.
National Center for Biotechnology Information, Entrez Genomes [http://www.ncbi.nlm.nih.gov/entrez/query.fcgi?db=Genome]
Return to citation in text: [1] [2]
27.
The Institute for Genomic Research Microbial Genome Database [http://www.tigr.org/tdb/mdb/mdb.html]
Return to citation in text: [1] [2]
28.
Kawarabayasi Y, Hino Y, Horikawa H, Yamazaki S, Haikawa Y, Jin-no K, Takahashi M, Sekine M, Baba S, Ankai A, et al.: Complete genome sequence of an aerobic hyper-thermophilic crenarchaeon, Aeropyrum pernix K1.
DNA Res 1999, 6:83-101. [PubMed Abstract] [Publisher Full Text]
Return to citation in text: [1]
29.
Deckert G, Warren PV, Gaasterland T, Young WG, Lenox AL, Grahams DE, Overbeek R, Snead MA, Keller M, Aujay M, et al.: The complete genome of the hyperthemophilic bacterium Aquifex aeolicus.
Nature 1998, 392:353-358. [PubMed Abstract] [Publisher Full Text]
Return to citation in text: [1]
30.
Klenk H-P, Clayton RA, Tomb J-F, White O, Nelsen KE, Ketchum KA, Dodson RJ, Gwinn M, Hickey EK, Peterson JD, et al.: The complete genomic sequence of the hyperthermophilic, sulfate-reducing archaeon Archaeoglobus fulgidus.
Nature 1997, 390:364-370. [PubMed Abstract] [Publisher Full Text]
Return to citation in text: [1]
31.
Kunst A, Ogasawara N, Moszer I, Albertini A, Alloni G, Azevedo V, Bertero M, Bessieres P, Bolotin A, Borchert S, et al.: The complete genome sequence of the Gram-positive bacterium Bacillus subtilis.
Nature 1997, 390:249-256. [PubMed Abstract] [Publisher Full Text]
Return to citation in text: [1]
32.
Fraser CM, Norris SJ, Weinstock GM, White O, Sutton GG, Dodson R, Gwinn M, Hickey EK, Clayton R, Ketchum KA, et al.: Genomic sequence of a Lyme disease spirochaete, Borrelia burgdorferi.
Nature 1997, 390:580-586. [PubMed Abstract] [Publisher Full Text]
Return to citation in text: [1]
33.
Parkhill J, Wren BW, Mungall K, Ketley JM, Churcher C, Basham D, Chillingworth T, Davies RM, Feltwell T, Holroyd S, et al.: The genome sequence of the food-borne pathogen Campylobacter jejuni reveals hypervariable sequences.
Nature 2000, 403:665-668. [PubMed Abstract] [Publisher Full Text]
Return to citation in text: [1]
34.
Kalman S, Mitchell W, Marathe R, Lammel C, Fan J, Hyman RW, Olinger L, Grimwood J, Davis RW, Stephens RS: Comparative genomes of Chlamydia pneumoniae and C. trachomatis.
Nat Genet 1999, 21:385-389. [PubMed Abstract] [Publisher Full Text]
Return to citation in text: [1]
35.
Stephens RS, Kalman S, Lammel C, Fan J, Marathe R, Aravind L, Mitchell W, Olinger L, Tatusov RL, Zhao Q, et al.: Genome sequence of an obligate intracellular pathogen of humans: Chlamydia trachomatis.
Science 1998, 282:754-759. [PubMed Abstract] [Publisher Full Text]
Return to citation in text: [1]
36.
White O, Eisen JA, Heidelberg JF, Hickey EK, Peterson JD, Dodson RJ, Haft DH, Gwinn ML, Nelson WC, Richardson DL, et al.: Genome sequence of the radioresistant bacterium Deinococcus radiodurans R1.
Science 1999, 286:1571-1577. [PubMed Abstract] [Publisher Full Text]
Return to citation in text: [1]
37.
Fleischmann RD, Adams MD, White O, Clayton RA, Kirkness EF, Kerlavage AR, Bult CJ, Tomb JF, Dougherty BA, Merrick JM, et al.: Whole-genome random sequencing and assembly of Haemophilus influenzae Rd.
Science 1995, 269:496-512. [PubMed Abstract] [Publisher Full Text]
Return to citation in text: [1]
38.
Tomb JF, White O, Kerlavage AR, Clayton RA, Sutton GG, Fleischmann RD, Ketchum KA, Klenk HP, Gill S, Dougherty BA, et al.: The complete genome sequence of the gastric pathogen Helicobacter pylori.
Nature 1997, 388:539-547. [PubMed Abstract] [Publisher Full Text]
Return to citation in text: [1]
39.
Alm RA, Ling LS, Moir DT, King BL, Brown ED, Doig PC, Smith DR, Noonan B, Guild BC, deJonge BL, et al.: Genomic-sequence comparison of two unrelated isolates of the human gastric pathogen Helicobacter pylori.
Nature 1999, 397:176-180. [PubMed Abstract] [Publisher Full Text]
Return to citation in text: [1]
40.
Smith DR, Doucette-Stamm LA, Deloughery C, Lee H, Dubois J, Aldredge T, Bashirzadeh R, Blakely D, Cook R, Gilbert K, et al.: Complete genome sequence of Methanobacterium thermoautotrophicum DH: functional analysis and comparative genomics.
J Bacteriol 1996, 179:7135-7155.
Return to citation in text: [1]
41.
Bult CJ, White O, Olsen GJ, Zhou L, Fleischmann RD, Sutton GG, Blake JA, Fitzgerald LM, Clayton RA, Gocayne JD, et al.: Complete genome sequence of the methanogenic archaeon, Methanococcus jannaschii.
Science 1996, 273:1058-1073. [PubMed Abstract] [Publisher Full Text]
Return to citation in text: [1]
42.
Fraser CM, Gocayne JD, White O, Adams MD, Clayton RA, Fleischmann RD, Bult CJ, Kerlavage AR, Sutton G, Kelley JM, et al.: The minimal gene complement of Mycoplasma genitalium.
Science 1995, 270:397-403. [PubMed Abstract] [Publisher Full Text]
Return to citation in text: [1]
43.
Himmelreich R, Hilbert H, Plagens H, Pirkl E, Li BC, Herrmann R: Complete sequence analysis of the genome of the bacterium Mycoplasma pneumoniae.
Nucleic Acids Res 1996, 24:4420-4449. [PubMed Abstract] [Publisher Full Text] [PubMed Central Full Text]
Return to citation in text: [1]
44.
Parkhill J, Achtman M, James KD, Bentley SD, Churcher C, Klee SR, Morelli G, Basham D, Brown D, Chillingworth T, et al.: Complete DNA sequence of a serogroup A strain of Neisseria meningitidis Z2491.
Nature 2000, 404:502-506. [PubMed Abstract] [Publisher Full Text]
Return to citation in text: [1]
45.
Kawarabayasi Y, Sawada M, Horikawa H, Haikawa Y, Hino Y, Yamamoto S, Sekine M, Baba S, Kosugi H, Hosoyama A, et al.: Complete sequence and gene organization of the genome of a hyperthermophilic archaebacterium, Pyrococcus horikoshii OT3.
DNA Res 1998, 5:55-76. [PubMed Abstract] [Publisher Full Text]
Return to citation in text: [1]
46.
Andersson SG, Zomorodipour A, Andersson JO, Sicheritz-Ponten T, Alsmark UC, Podowski RM, Naslund AK, Eriksson AS, Winkler HH, Kurland CG: The genome sequence of Rickettsia prowazekii and the origin of mitochondria.
Nature 1998, 396:133-140. [PubMed Abstract] [Publisher Full Text]
Return to citation in text: [1]
47.
Kaneko T, Sato S, Kotani H, Tanaka A, Asamizu E, Nakamura Y, Miyajima N, Hirosawa M, Sugiura M, Sasamoto S, et al.: Sequence analysis of the genome of the unicellular cyanobacterium Synechocystis sp. strain PCC6803. II. Sequence determination of the entire genome and assignment of potential protein-coding regions.
DNA Res 1996, 3:109-136. [PubMed Abstract] [Publisher Full Text]
Return to citation in text: [1]
48.
Nelson KE, Clayton RA, Gill SR, Gwinn ML, Dodson RJ, Haft DH, Hickey EK, Peterson JD, Nelson WC, Ketchum KA, et al.: Evidence for lateral gene transfer between Archaea and bacteria from genome sequence of Thermotoga maritima.
Nature 1999, 399:323-329. [PubMed Abstract] [Publisher Full Text]
Return to citation in text: [1]
49.
Fraser CM, Norris SJ, Weinstock GM, White O, Sutton GG, Dodson R, Gwinn M, Hickey EK, Clayton R, Ketchum KA, et al.: Complete genome sequence of Treponema pallidum, the syphilis spirochete.
Science 1998, 281:375-388. [PubMed Abstract] [Publisher Full Text]
Return to citation in text: [1]
50.
Pearson WR: Flexible sequence similarity searching with the FASTA3 program package.
Methods Mol Biol 2000, 132:185-219. [PubMed Abstract] [Publisher Full Text]
Return to citation in text: [1]
51.
Marsh RC, Worcel A: A DNA fragment containing the origin of replication of the Escherichia coli chromosome.
Proc Natl Acad Sci USA 1977, 74:2720-2724. [PubMed Abstract] [Publisher Full Text]
Return to citation in text: [1]
52.
Salazar L, Fsihi H, de Rossi E, Riccardi G, Rios C, Cole ST, Takiff HE: Organization of the origins of replication of the chromosomes of Mycobacterium smegmatis, Mycobacterium leprae and Mycobacterium tuberculosis and isolation of a functional origin from M. smegmatis.
Mol Microbiol 1996, 20:283-293. [PubMed Abstract] [Publisher Full Text]
Return to citation in text: [1]
53.
Lobry JR: Asymmetric substitution patterns in the two DNA strands of bacteria.
Mol Biol Evol 1996, 13:660-665. [PubMed Abstract] [Publisher Full Text]
Return to citation in text: [1]
54.
Salzberg SL, Salzberg AJ, Kerlavage AR, Tomb JF: Skewed oligomers and origins of replication.
Gene 1998, 217:57-67. [PubMed Abstract] [Publisher Full Text]
Return to citation in text: [1]
I am posting here my recent paper that just came out in PLoS Biology on Environmental Shotgun Sequencing. With PLoS’s Creative Commons license I am allowed to do this, which makes me happy. The citation is Eisen JA (2007) Environmental Shotgun Sequencing: Its Potential and Challenges for Studying the Hidden World of Microbes. PLoS Biol 5(3): e82 doi:10.1371/journal.pbio.0050082


Citation: Eisen JA (2007) Environmental Shotgun Sequencing: Its Potential and Challenges for Studying the Hidden World of Microbes. PLoS Biol 5(3): e82 doi:10.1371/journal.pbio.0050082
Published: March 13, 2007
Copyright: © 2007 Jonathan A. Eisen. This is an open-access article distributed under the terms of the Creative Commons Attribution License, which permits unrestricted use, distribution, and reproduction in any medium, provided the original author and source are credited.
Abbreviations: ESS, environmental shotgun sequencing; PCR, polymerase chain reaction; rRNA, ribosomal RNA
Jonathan A. Eisen is at the University of California Davis Genome Center, with joint appointments in the Section of Evolution and Ecology and the Department of Medical Microbiology and Immunology, Davis, California, United States of America. Web site: http://phylogenomics.blogspot.com. E-mail:jaeisen@ucdavis.edu
Series Editor: Simon Levin, Princeton University, United States of America
This article is part of the Oceanic Metagenomics collection in PLoS Biology. The full collection is available online at http://collections.plos.org/plosbiology/gos-2007.php.
Since their discovery in the 1670s by Anton van Leeuwenhoek, an incredible amount has been learned about microorganisms and their importance to human health, agriculture, industry, ecosystem functioning, global biogeochemical cycles, and the origin and evolution of life. Nevertheless, it is what is not known that is most astonishing. For example, though there are certainly at least 10 million species of bacteria, only a few thousand have been formally described [1]. This contrasts with the more than 350,000 described species of beetles [2]. This is one of many examples indicative of the general difficulties encountered in studying organisms that we cannot readily see or collect in large samples for future analyses. It is thus not surprising that most major advances in microbiology can be traced to methodological advances rather than scientific discoveries per se.
Examples of these key revolutionary methods (Table 1) include the use of microscopes to view microbial cells, the growth of single types of organisms in the lab in isolation from other types (culturing), the comparison of ribosomal RNA (rRNA) genes to construct the first tree of life that included microbes [3], the use of the polymerase chain reaction (PCR) [4] to clone rRNA genes from organisms without culturing them [5–7], and the use of high-throughput “shotgun” methods to sequence the genomes of cultured species [8]. We are now in the midst of another such revolution—this one driven by the use of genome sequencing methods to study microbes directly in their natural habitats, an approach known as metagenomics, environmental genomics, or community genomics [9].
In this essay I focus on one particularly promising area of metagenomics—the use of shotgun genome methods to sequence random fragments of DNA from microbes in an environmental sample. The randomness and breadth of this environmental shotgun sequencing (ESS)—first used only a few years ago [10,11] and now being used to assay every microbial system imaginable from the human gut [12] to waste water sludge [13]—has the potential to reveal novel and fundamental insights into the hidden world of microbes and their impact on our world. However, the complexity of analysis required to realize this potential poses unique interdisciplinary challenges, challenges that make the approach both fascinating and frustrating in equal measure.
One of the most important and conceptually straightforward steps in studying any ecosystem involves cataloging the types of organisms and the numbers of each type. For a long time, such typing and counting was an almost insurmountable problem in microbiology. This is largely because physical appearance does not provide a valid taxonomic picture in microbes. Appearance evolves so rapidly that two closely related taxa may look wildly different and two distantly related taxa may look the same. This vexing problem was partially overcome in the 1980s through the use of rRNA-PCR (Table 1). This method allows microorganisms in a sample to be phylogenetically typed and counted based on the sequence of their rRNA genes, genes that are present in all cell-based organisms. In essence, a database of rRNA sequences [14,15] from known organisms functions like a bird field guide, and finding a rRNA-PCR product is akin to seeing a bird through binoculars. Rather than counting species, this approach focuses on “phylotypes,” which are defined as organisms whose rRNA sequences are very similar to each other (a cutoff of >97% or >99% identical is frequently used). The ability to use phylotyping to determine who was out there in any microbial sample has revolutionized environmental microbiology [16], led to many discoveries [e.g., 17], and convinced many people (myself included) to become microbiologists.
The selective targeting of a single gene makes rRNA-PCR an efficient method for deep community sampling [18]. However, this efficiency comes with limitations, most of which are complemented or circumvented by the randomness and breadth of ESS. For example, examination of the random samples of rRNA sequences obtained through ESS has already led to the discovery of new taxa—taxa that were completely missed by PCR because of its inability to sample all taxa equally well (e.g., [19]). In addition, ESS provides the first robust sampling of genes other than rRNA, and many of these genes can be more useful for some aspects of typing and counting. Some universal protein coding genes are better than rRNA both for distinguishing closely related strains (because of third position variation in codons) and for estimating numbers of individuals (because they vary less in copy number between species than do rRNA genes) [10]. Perhaps most significantly, ESS is providing groundbreaking insights into the diversity of viruses [20,21], which lack rRNA genes and thus were left out of the previous revolution.
Certainly, many challenges remain before we can fully realize the potential of ESS for the typing and counting of species, including making automated yet accurate phylogenetic trees of every gene, determining which genes are most useful for which taxa, combining data from different genes even when we do not know if they come from the same organisms, building up databases of genes other than rRNA, and making up for the lack of depth of sampling. If these challenges are met, ESS has the potential to rewrite much of what we thought we knew about the phylogenetic diversity of microbial life.
A community is, of course, more than a list of types of organisms. One approach to understanding the properties and functioning of a microbial community is to start with studies of the different types of organisms and build up from these individuals to the community. Ideally, to do this one would culture each of the phylotypes and study its properties in the lab. Unfortunately, many, if not most, key microbes have not yet been cultured [22]. Thus, for many years, the only alternative was to make predictions about the biology of particular phylotypes based on what was known about related organisms. Unfortunately, this too does not work well for microbes since very closely related organisms frequently have major biological differences. For example, Escherichia coli K12 and E. coli O157:H7 are strains of the same species (and considered to be the same phylotype), with genomes containing only about 4,000 genes, yet each possesses hundreds of functionally important genes not seen in the other strain [23]. Such differences are routine in microbes, and thus one cannot make any useful inferences about what particular phylotypes are doing (e.g., type of metabolism, growth properties, role in nutrient cycling, or pathogenicity) based on the activities of their relatives.
These difficulties—the inability to culture most microbes and the functional disparities between close relatives—led to one of the first kinds of metagenomic analyses, wherein predictions of function were made from analysis of the sequence of large DNA fragments from representatives of known phylotypes. This approach has provided some stunning insights, such as the discovery of a novel form of phototrophy in the oceans [24]. However, this large insert approach has the same limitation as predicting properties from characterized relatives—a single cell cannot possibly represent the biological functions of all members of a phylotype.
ESS provides an alternative, more global way of assessing biological functions in microbial communities. As when using the large insert approach, functions can be predicted from sequences. However, in this case the predicted functions represent a random sampling of those encoded in the genomes of all the organisms present. This approach has unquestionably been wildly successful in terms of gene discovery. For example, analysis of ESS data has revealed novel forms of every type of gene family examined, as well as a great number of completely novel families (e.g., [25]). However, there is a major caveat when using ESS data to make community-level inferences. Ecosystems are more than just a bag of genes—they are made up of compartments (e.g., cells, chromosomes, and species), and these compartments matter. The key challenge in analyzing ESS data is to sort the DNA fragments (which are usually less than 1,000 base pairs long relative to genome sizes of millions or billions of bases) into bins that correspond to compartments in the system being studied.
A recent study by myself and colleagues illustrates the importance of compartments when interpreting ESS data. When we analyzed ESS data from symbionts living inside the gut of the glassy-winged sharpshooter (an insect that has a nutrient-limited diet), we were able to bin the data to two distinct symbionts [26]. We then could infer from those data that one of the symbionts synthesizes amino acids for the host while the other synthesizes the needed vitamins and cofactors. Modeling and understanding of this ecosystem are greatly enhanced by the demonstration of this complementary division of labor, in comparison to simply knowing that amino acids, vitamins, and cofactors are made by “symbionts.”
How does one go about binning ESS data? A variety of approaches have been developed, some of which are described in Table 2. In considering the different binning methods and their limitations, the first question one needs to ask is, what are we trying to bin? Is it fragments from the same chromosome from a single cell, which would be useful for studying chromosome structure? If so, then perhaps genome assembly methods are the best. What if instead, as in the sharpshooter example, we are trying to have each bin include every fragment that came from a particular species, knowledge which may be useful for predicting community metabolic potential? If the level of genetic polymorphism among individual cells from the same species is high, then genome assembly methods may not work well (the polymorphisms will break up assemblies). A better approach might be to look for species-specific “word” frequencies in the DNA, such as ones created by patterns in codon usage. The challenge is, how do we tune the methods to find the right target level of resolution? If we are too stringent, most bins will include only a few fragments. But if we are too relaxed, we will create artificial constructs that may prove biologically misleading, such as grouping together sequences from different species. To make matters more complex, most likely the stringency needed will vary for different taxa present in the sample.
Another critical issue is the diversity of the system under study. Generally, binning works better when there are few different phylotypes present, all of which are distantly related and form discrete populations. This is why binning works well for the sharpshooter system and other relatively isolated, low diversity environments. Binning increases in difficulty exponentially as the number of species increases: the populations and species start to merge together, and the populations get more and more polymorphic and variable in relative abundance (such as in the paper about the Global Ocean Sampling expedition in this issue [27]). Further complicating binning is the phenomenon of lateral gene transfer, where genes are exchanged between distantly related lineages at rates that are high enough that random sampling of a genome will frequently include genes with multiple histories.
Despite these challenges, I believe we can develop effective binning methods for complex communities. First, we can combine different approaches together, such as using one method to sort in a relaxed manner and then using another to subdivide the bins provided by the first method. Second, we can incorporate new approaches such as population genetics into the analysis [28]. In addition, the lessons learned here can be applied to other aspects of metagenomics (e.g., the counting and typing discussed above) and provide insights into the nature of microbial genomes and the structure of microbial populations and communities.
So far, I have discussed issues relating mostly to intrasample analysis of ESS data. However, the area with perhaps the most promise involves the comparative analysis of different samples. This work parallels the comparative analysis of genomes of cultured species. Initial studies of that type compared distantly related taxa with enormous biological differences. What has been learned from these studies pertains mostly to core housekeeping functions, such as translation and DNA metabolism, and to other very ancient processes [29,30]. It was not until comparisons were made between closely related organisms that we began to understand events that occurred on shorter time scales, such as selection, gene transfer, and mutation processes [31]. Similarly, the initial comparisons of ESS data involved comparisons of wildly different environments [32], yielding insights into the general structure of communities. But as more comparisons are made between similar communities [33,34], such as those sampled during vertical and horizontal ocean transects [27,35–37], we will begin to learn about shorter time scale processes such as migration, speciation, extinction, responses to disturbance, and succession. It is from a combination of both approaches—comparing both similar and very divergent communities—that we will be able to understand the fundamental rules of microbial ecology and how they relate to ecological principles seen in macro-organisms.
In promoting some of the exciting opportunities with ESS, I do not want to give the impression that it is flawless. It is helpful in this respect to compare ESS to the Internet. As with the Internet, ESS is a global portal for looking at what occurs in a previously hidden world. Making sense of it requires one to sort through massive, random, fragmented collections of bits of information. Such searches need to be done with caution because any time you analyze such a large amount of data patterns can be found. In addition, as with the Internet, there is certainly some hype associated with ESS that gives relatively trivial findings more attention than they deserve. Overall, though, I believe the hype is deserved. As long as we treat ESS as a strong complement to existing methods, and we build the tools and databases necessary for people to use the information, it will live up to its revolutionary potential.
I thank Simon Levin, Joshua Weitz, Jonathan Dushoff, Maria-Inés Benito, Doug Rusch, Aaron Halpern, and Shibu Yooseph for helpful discussions, and Melinda Simmons, Merry Youle, and three anonymous reviewers for helpful comments on the manuscript. The writing of this paper was supported by National Science Foundation Assembling the Tree of Life Grant 0228651 to Jonathan A. Eisen and by the Defense Advanced Research Projects Agency under grants HR0011-05-1-0057 and FA9550-06-1-0478.
For those interested in metagenomics, microbial diversity and ocean microbiology, there will be a press conference tomorrow run by the Venter Institute relating to a series of papers (I am an author on some) coming out in PLoS Biology. The papers relate to Venter’s Global Ocean Voyage – sailing around the world collecting microbial samples. These were then used for environmental shotgun sequencing and the papers discuss various aspects of analzying the data.
Say what you want about metagenomics, and Craig and genomics, if you are a critic. But (1) read the papers, (2) give Venter some credit for publishing in an Open Access journals unlike many of the so called “public” genome effort folks who generally only pretend to support public/open access to anything.
Here is a link to view the live web cast of the PloS Biology GOS Expedition publication press conference. The press conference will be held tomorrow March 13 from 10-11 a.m. EST. After tomorrow an archive of the web cast will be hosted on the JCVI web site.
The papers are now live on the PLoS Biology Web Site.
The Global Ocean Sampling Collection can be found here.
My essay on Environmental Shotgun Sequencing can be found here.
Apparently, there is a building controversy within Berkeley over the recently announced $500 million dollar deal with BP on a biofuel program. A series of articles (e.g., here) in the SF Chronicle have been reporting on the deal and the more recent ones are starting to document some potential issues with the deal. Also see the Berkeley Daily Planet commentary.
From the Chron:
UC Berkeley‘s $500 million energy research deal with oil giant BP took a pounding at a faculty forum Thursday, with a host of speakers critical of the unprecedented partnership — some bitingly so.
I am quite interested in this because although I think it is great that Berkeley/LBL are going to now be moving big time into biofuels research, I have heard and read a variety of things regarding this deal that make one want to look at it more carefully. Some of the grumblings may be related to the standard anti-GMO opinions pervasive in Berkeley, but some of them may be more significant. For example when I gave a talk at Berkeley a few weeks ago, I asked as many people as I could why Berkeley picked U. Illinois to be their agricultural partner on the project and not Davis. And the answer was basically always the same – supposedly people at Berkeley were told by BP that Davis could not be involved because Davis had recently singed a collaborative agreement with Chevron over biofuels research.
Now folks at Berkeley are welcome to choose whomever they want to be involved in the project. But if they were told by BP that Davis could not be involved, that suggests academic freedom was tossed out the window. This thing is – I have been having a hard time getting any straight answers from people involved in the LBL/Berkeley side of things. So I had forgotten about the whole thing when someone sent me a link to the Chron story. What really caught my attention is the quote from Paul Rabinow in the article:
Anthropology Professor Paul Rabinow cited the 1998-2003 research deal between Swiss biotech firm Novartis and Cal’s Department of Plant and Microbial Biology. That deal, which provided for $5 million a year from 1998 to 2003, was intended to develop genetically engineered foods. It sparked campus protests and was criticized at the time by faculty members who felt it was implemented without collegial debate.
“The way the university handled it was completely, recklessly stupid,” Rabinow said.
The same mistakes are being repeated with the BP deal, he said.
“It should have been transparent, there should have been consultation,” he said. “This is silly. You should have given us more time to debate this.”
I met Paul at a workshop at Berkeley on the field of Synthetic Biology and he struck me as one of the most sensible people in the crowd even though he was not directly involved in Synthetic Biology research. He gave a talk at the meeting that was really spectacular (I think you see the talk here). Since newspaper articles do not always get the whole story correct, I am not certain how accurately they represent Paul’s real concerns regarding the BP deal.
But from the article it sounds like the Berkeley and LBL administration may not have consulted the faculty broadly on the nature of the deal. That would be a bad thing since such secrecy is, as Rabinow implied, not the right way to get community support. In addition, it sounds like some of the people involved in the project have let the large amount of money go to their heads (one faculty member was reported to have said that Berkeley “researchers can’t afford to fail on a project of such magnitude” as though it was the amount of money that determined whether one should do a good job on something, which is silly).
So I guess the question that is unresolved is – did Berkeley and LBL compromise their principles for a pot of gold? I do not know but I hope they get moving in front of this really rally fast and (1) make sure the deal is on the up and up and (2) become more open about the whole thing. This is particularly important because I think LBL and Berkeley could become world leaders in biofuels research. But they could also cause biofuels research to end up being treated like all genetic engineering work if they are not careful. And that would be a bad thing since if done right, biofuels have enormous potential. Here’s hoping Berkeley/LBL/BP change tactics, and get rid of the whole secrecy thing and move every detail of the project into the open.
A webcast of the meeting is here.
From an article in the SF Chronicle
The federal agency responsible for protecting Arctic polar bears has
barred two Alaska scientists from speaking about polar bears, climate
change or sea ice at international meetings in the next few weeks, a move
that environmentalists say is censorship.
I try in this blog to not get involved in too many political issues – except of course those related to Open Access publishing. I do this because I think Open Access needs support from all sides of the political spectrum and because there are many things about Open Access that are consistent with political views throughout the spectrum. However, the treatment of scientists by the Federal Government just keeps getting worse and worse. Stem Cells. Evolution. Global Warming. Food science. And so on. The feds seem to think that scientific research is another form of spin. Scientists should read this chronicle article and really should start fighting back more.
So from now on I am adding intellectual freedom for scientists as another topic area of my blog.
OH, and thanks to Melinda Simmons at the Moore Foundation for suggesting this for my blog
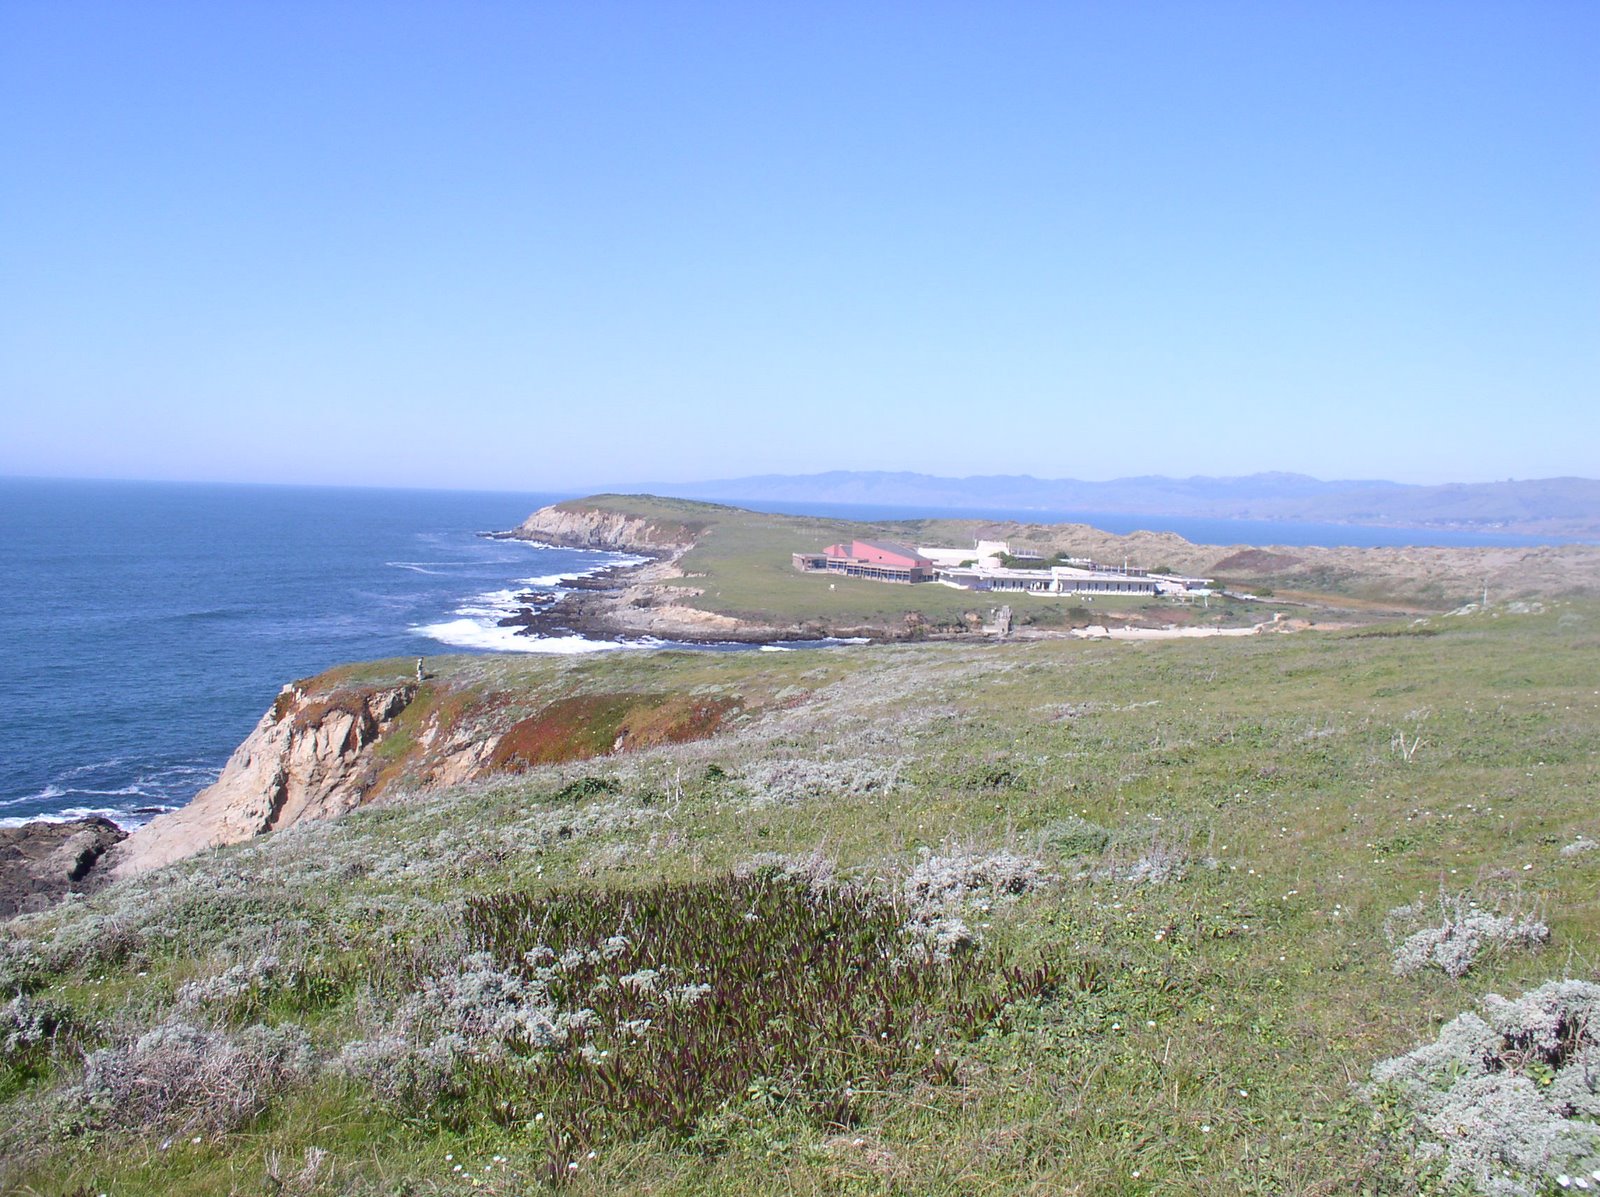


Well, gave a talk today out at Bodega Bay as part of the U. C. Davis workshop in Applied Phylogenetics. I talked about my favorite topic, phylogenomics (always good to preach, even to the converted) and enjoyed meeting the students and talking to the other faculty. But the main resons for this blog — Davis’ marine lab on a nice day is simply spectacular. If I ever teach a workshop I am going to try and hold it there.


