Journal club today on bacteria in toilets – posting some notes here

I am heading a journal club discussion today of the following paper: PLoS ONE: Microbial Biogeography of Public Restroom Surfaces
I am going to use this page/post to put up some notes for the discussion.  Fortunately I have a good guide in this – Rob Dunn wrote a nice commentary/review for Scientific American blogs: Public bathrooms house thousands of kinds of bacteria
Stay tuned/come back to this page as I will be posting some more notes. Any suggestions for other things to look at/discuss would be welcome.

Notes (I note – I am copying much of the text from the paper not rewriting it.)
What was sampled?

Ten surfaces (door handles into and out of the restroom, handles into and out of a restroom stall, faucet handles, soap dispenser, toilet seat, toilet flush handle, floor around the toilet and floor around the sink) in six male and six female restrooms evenly distributed across two buildings on the University of Colorado at Boulder campus were sampled on a single day in November 2010. 

How did they collect samples?

Surfaces where sampled using sterile, cotton-tipped swabs as described previously [14], [15]. As the 12 restrooms were nearly identical in design, we were able to swab the same area at each location between restrooms. In order to characterize tap water communities as a potential source of bacteria, 1 L of faucet water from six of the restrooms (each building having the same water source for each restroom sampled) was collected and filtered through 0.2 µm bottle top filters (Nalgene, Rochester, NY, USA). 

How did they get DNA?

Genomic DNA was extracted from the swabs and filters using the MO BIO PowerSoil DNA isolation kit following the manufacturer’s protocol with the modifications of Fierer et al. [14]. 

How did they get sequence data?

A portion of the 16 S rRNA gene spanning the V1–V2 regions was amplified using the primer set (27 F/338R), PCR mixture conditions and thermal cycling conditions described in Fierer et al. [15]. PCR amplicons of triplicate reactions for each sample were pooled at approximately equal amounts and pyrosequenced at 454 Life Sciences (Branford, CT, USA) on their GS Junior system. A total of 337,333 high-quality partial 16 S rRNA gene sequences were obtained from 101 of the 120 surface samples collected, averaging approximately 3,340 sequences per sample (ranging from 513–6,771) (Table S1) in 4 GS Junior runs, with the best run containing 116,004 high-quality reads. An additional 16,416 sequences (ranging from 2161–5084 per sample) were generated for five of the six water samples collected for source tracking analysis. Each sample was amplified with a unique barcode to enable multiplexing in the GS Junior runs. The barcoded sequencing reads can be separated by data analysis software providing high confidence in assigning sequencing read to each sample. Sequence data generated as part of this study is available upon request by contacting the corresponding author.

How did they analyze the data?

All sequences generated for this study and previously published data sets used for source tracking (see below) were processed and sorted using the default parameters in QIIME [16]. Briefly, high-quality sequences (>200 bp in length, quality score >25, exact match to barcode and primer, and containing no ambiguous characters) were trimmed to 300 bp and clustered into operational taxonomic units (OTUs) at 97% sequence identity using UCLUST [17]. Representative sequences for each OTU were then aligned using PyNAST [18] against the Greengenes core set [19] and assigned taxonomy with the RDP-classifier [20]. Aligned sequences were used to generate a phylogenetic tree with FastTree [21] for both alpha- (phylogenetic diversity, PD)[22] and beta-diversity (unweighted UniFrac) [23] metrics. The unweighted UniFrac metric, which only accounts for the presence/absence of taxa and not abundance, was used to determine the phylogenetic similarity of the bacterial communities associated with the various restroom surfaces. The UniFrac distance matrix was imported into PRIMER v6 where principal coordinate analysis (PCoA) and analysis of similarity (ANOSIM) were conducted to statistically test the relationship between the various communities [24]. In order to eliminate potential biases introduced by sampling depth, all samples (including those used in source tracking) were rarified to 500 sequences per sample for taxonomic, alpha-diversity (PD), beta-diversity (UniFrac) and source tracking comparisons.

Sourcetracking

To determine the potential sources of bacteria on restroom surfaces and how the importance of different sources varied across the sampled locations, we used the newly developed SourceTracker software package [25]. The SourceTracker model assumes that each surface community is merely a mixture of communities deposited from other known or unknown source environments and, using a Bayesian approach, the model provides an estimate of the proportion of the surface community originating from each of the different sources. When a community contains a mixture of taxa that do not match any of the source environments, that portion of the community is assigned to an “unknown” source. Potential sources we examined included human skin (n = 194), mouth (n = 46), gut (feces) (n = 45) [26] and urine (n = 50), as well as soil (n = 88) [27] and faucet water (n = 5, see above). For skin communities, sequences collected from eight body habitats (palm, index finger, forearm, forehead, nose, hair, labia minora, glans penis) from seven to nine healthy adults on four occasions were used to determine the average community composition of human skin [26]. The mouth (tongue and cheek swabs), gut and urine communities were determined from the same individuals although the urine-associated communities were not published in the initial report of these data [26]. While urine is generally considered to be sterile, it does pick up bacteria associated with the urethra and genitals [28], [29]. The average soil community was determined from a broad diversity of soil types collected across North and South America [27].

—————————————————————
Notes on Sourcetracking

Abstract to paper:

Contamination is a critical issue in high-throughput metagenomic studies, yet progress toward a comprehensive solution has been limited. We present SourceTracker, a Bayesian approach to estimate the proportion of contaminants in a given community that come from possible source environments. We applied SourceTracker to microbial surveys from neonatal intensive care units (NICUs), offices and molecular biology laboratories, and provide a database of known contaminants for future testing.

Some lines from paper

We developed SourceTracker, a Bayesian approach to identifying sources and proportions of contamination in marker-gene and functional metagenomics studies. Our approach models contamination as a mixture of entire source communities into a sink community, where the mixing proportions are unknown.

SourceTracker’s distinguishing features are its direct estimation of source proportions and its Bayesian modeling of uncertainty about known and unknown source environments.

SourceTracker outperformed these methods (NAIVE BAYES AND RANDOM FORESTS) because it allows uncertainty in the source and sink distributions, and because it explicitly models a sink sample as a mixture of sources.

SourceTracker also assumes that an environment cannot be both a source and a sink, and we recommend research into bidirectional models.

Based on our results, simple analytical steps can be suggested for tracking sources and assessing contamination in newly acquired datasets. Although source-tracking estimates are limited by the comprehensiveness of the source environments used for training, large-scale projects such as the Earth Microbiome Project will dramatically expand the availability of such resources. SourceTracker is applicable not only to source tracking and forensic analysis in a wide variety of microbial community surveys (where did this biofilm come from?), but also to shotgun metagenomics and other population-genetics data. We made our implementation of SourceTracker available as an R package (http://sourcetracker.sf.net/), and we advocate automated tests of deposited data to screen samples that may be contaminated before deposition.

Who was there?

A total of 19 phyla were observed across all restroom surfaces with most sequences (≈92%) classified to one of four phyla: Actinobacteria,Bacteroidetes, Firmicutes or Proteobacteria (Figure 1A, Table S2). Previous cultivation-dependent and –independent studies have also frequently identified these as the dominant phyla in a variety of indoor environments [10][13]. Within these dominant phyla, taxa typically associated with human skin (e.g. Propionibacteriaceae,Corynebacteriaceae, Staphylococcaceae and Streptococcaceae) [30]were abundant on all surfaces (Figure 1A). The prevalence of skin bacteria on restroom surfaces is not surprising as most of the surfaces sampled come into direct contact with human skin, and previous studies have shown that skin associated bacteria are generally resilient and can survive on surfaces for extended periods of time [31], [32]. Many other human-associated taxa, including several lineages associated with the gut, mouth and urine, were observed on all surfaces (Figure 1A). Overall, these results demonstrate that, like other indoor environments that have been examined, the microbial communities associated with public restroom surfaces are predominantly composed of human-associated bacteria.

Figure 1. Taxonomic composition of bacterial communities associated with public restroom surfaces.
(A) Average composition of bacterial communities associated with restroom surfaces and potential source environments. (B) Taxonomic differences were observed between some surfaces in male and female restrooms. Only the 19 most abundant taxa are shown. For a more detailed taxonomic breakdown by gender including some of the variation see Supplemental Table S2.
doi:10.1371/journal.pone.0028132.g001


Comparative analysis

Comparisons of the bacterial communities on different restroom surfaces revealed that the communities clustered into three general categories: those communities found on toilet surfaces (the seat and flush handle), those communities on the restroom floor, and those communities found on surfaces routinely touched with hands (door in/out, stall in/out, faucet handles and soap dispenser) (Figure 2, Table 1). By examining the relative abundances of bacterial taxa across all of the restroom samples, we can identify taxa driving the overall community differences between these three general categories. Skin-associated bacteria dominate on those surfaces (the circles in Figure 2) that are routinely and exclusively (we hope) touched by hands and unlikely to come into direct contact with other body parts or fluids (Figure 3A). In contrast, toilet flush handles and seats (the asterisk-shaped symbols in Figure 2) were relatively enriched in Firmicutes (e.g.Clostridiales, Ruminococcaceae, Lachnospiraceae, etc.) andBacteroidetes (e.g. Prevotellaceae and Bacteroidaceae) (Figure 3B). These taxa are generally associated with the human gut [26],[33][35] suggesting fecal contamination of these surfaces. Fecal contamination could occur either via direct contact (with feces or unclean hands) or indirectly as a toilet is flushed and water splashes or is aerosolized [36][38]. From a public health perspective, the high number of gut-associated taxa throughout the restrooms is concerning because enteropathogenic bacteria could be dispersed in the same way as human commensals. Floor surfaces harbored many low abundance taxa (Table S2) and were the most diverse bacterial communities, with an average of 229 OTUs per sample versus most of the other sampled locations having less than 150 OTUs per sample on average (Table S1). The high diversity of floor communities is likely due to the frequency of contact with the bottom of shoes, which would track in a diversity of microorganisms from a variety of sources including soil, which is known to be a highly-diverse microbial habitat [27], [39]. Indeed, bacteria commonly associated with soil (e.g. Rhodobacteraceae, Rhizobiales, Microbacteriaceae and Nocardioidaceae) were, on average, more abundant on floor surfaces (Figure 3C, Table S2). Interestingly, some of the toilet flush handles harbored bacterial communities similar to those found on the floor (Figure 2, Figure 3C), suggesting that some users of these toilets may operate the handle with a foot (a practice well known to germaphobes and those who have had the misfortune of using restrooms that are less than sanitary).


Figure 2. Relationship between bacterial communities associated with ten public restroom surfaces.
Communities were clustered using PCoA of the unweighted UniFrac distance matrix. Each point represents a single sample. Note that the floor (triangles) and toilet (asterisks) surfaces form clusters distinct from surfaces touched with hands.
doi:10.1371/journal.pone.0028132.g002


Table 1. Results of pairwise comparisons for unweighted UniFrac distances of bacterial communities associated with various surfaces of public restrooms on the University of Colorado campus using the ANOSIM test in Primer v6.
doi:10.1371/journal.pone.0028132.t001


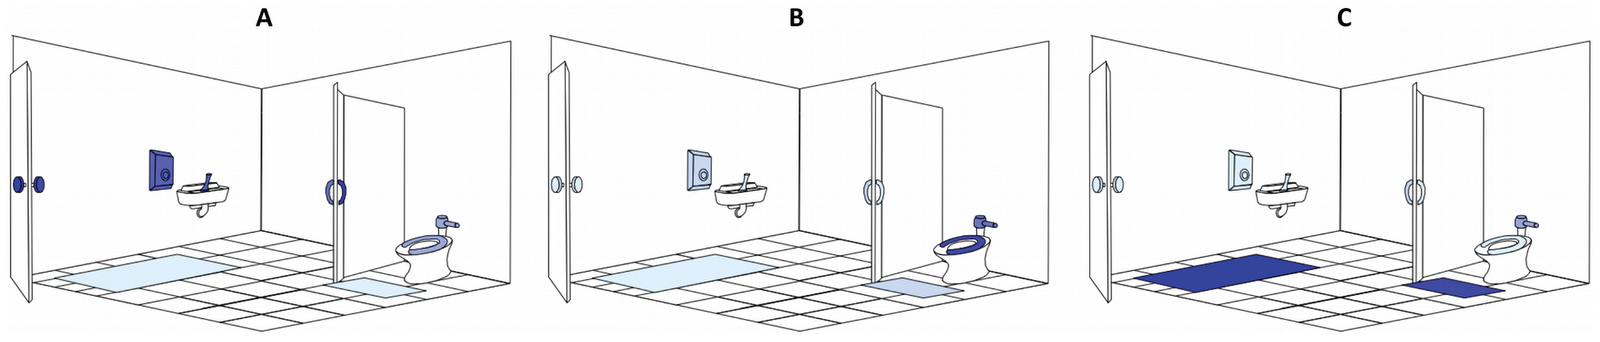
Figure 3. Cartoon illustrations of the relative abundance of discriminating taxa on public restroom surfaces.
Light blue indicates low abundance while dark blue indicates high abundance of taxa. (A) Although skin-associated taxa (PropionibacteriaceaeCorynebacteriaceae,Staphylococcaceae and Streptococcaceae) were abundant on all surfaces, they were relatively more abundant on surfaces routinely touched with hands. (B) Gut-associated taxa (ClostridialesClostridiales group XI, Ruminococcaceae,LachnospiraceaePrevotellaceae and Bacteroidaceae) were most abundant on toilet surfaces. (C) Although soil-associated taxa (Rhodobacteraceae, Rhizobiales, Microbacteriaceae and Nocardioidaceae) were in low abundance on all restroom surfaces, they were relatively more abundant on the floor of the restrooms we surveyed. Figure not drawn to scale.
doi:10.1371/journal.pone.0028132.g003

Comparisons 2 (Gender)

While the overall community level comparisons between the communities found on the surfaces in male and female restrooms were not statistically significant (Table S3), there were gender-related differences in the relative abundances of specific taxa on some surfaces (Figure 1B, Table S2). Most notably, Lactobacillaceae were clearly more abundant on certain surfaces within female restrooms than male restrooms (Figure 1B). Some species of this family are the most common, and often most abundant, bacteria found in the vagina of healthy reproductive age women [40], [41] and are relatively less abundant in male urine [28], [29]. Our analysis of female urine samples collected as part of a previous study [26] (Figure 1A), found that Lactobacillaceae were dominant in urine, therefore implying that surfaces in the restrooms where Lactobacillaceae were observed were contaminated with urine. Other studies have demonstrated a similar phenomenon, with vagina-associated bacteria having also been observed in airplane restrooms [11] and a child day care facility [10]. As we found that Lactobacillaceae were most abundant on toilet surfaces and those touched by hands after using the toilet (with the exception of the stall in), they were likely dispersed manually after women used the toilet. Coupling these observations with those of the distribution of gut-associated bacteria indicate that routine use of toilets results in the dispersal of urine- and fecal-associated bacteria throughout the restroom. While these results are not unexpected, they do highlight the importance of hand-hygiene when using public restrooms since these surfaces could also be potential vehicles for the transmission of human pathogens. Unfortunately, previous studies have documented that college students (who are likely the most frequent users of the studied restrooms) are not always the most diligent of hand-washers [42], [43].

Source Tracking


Human sources:

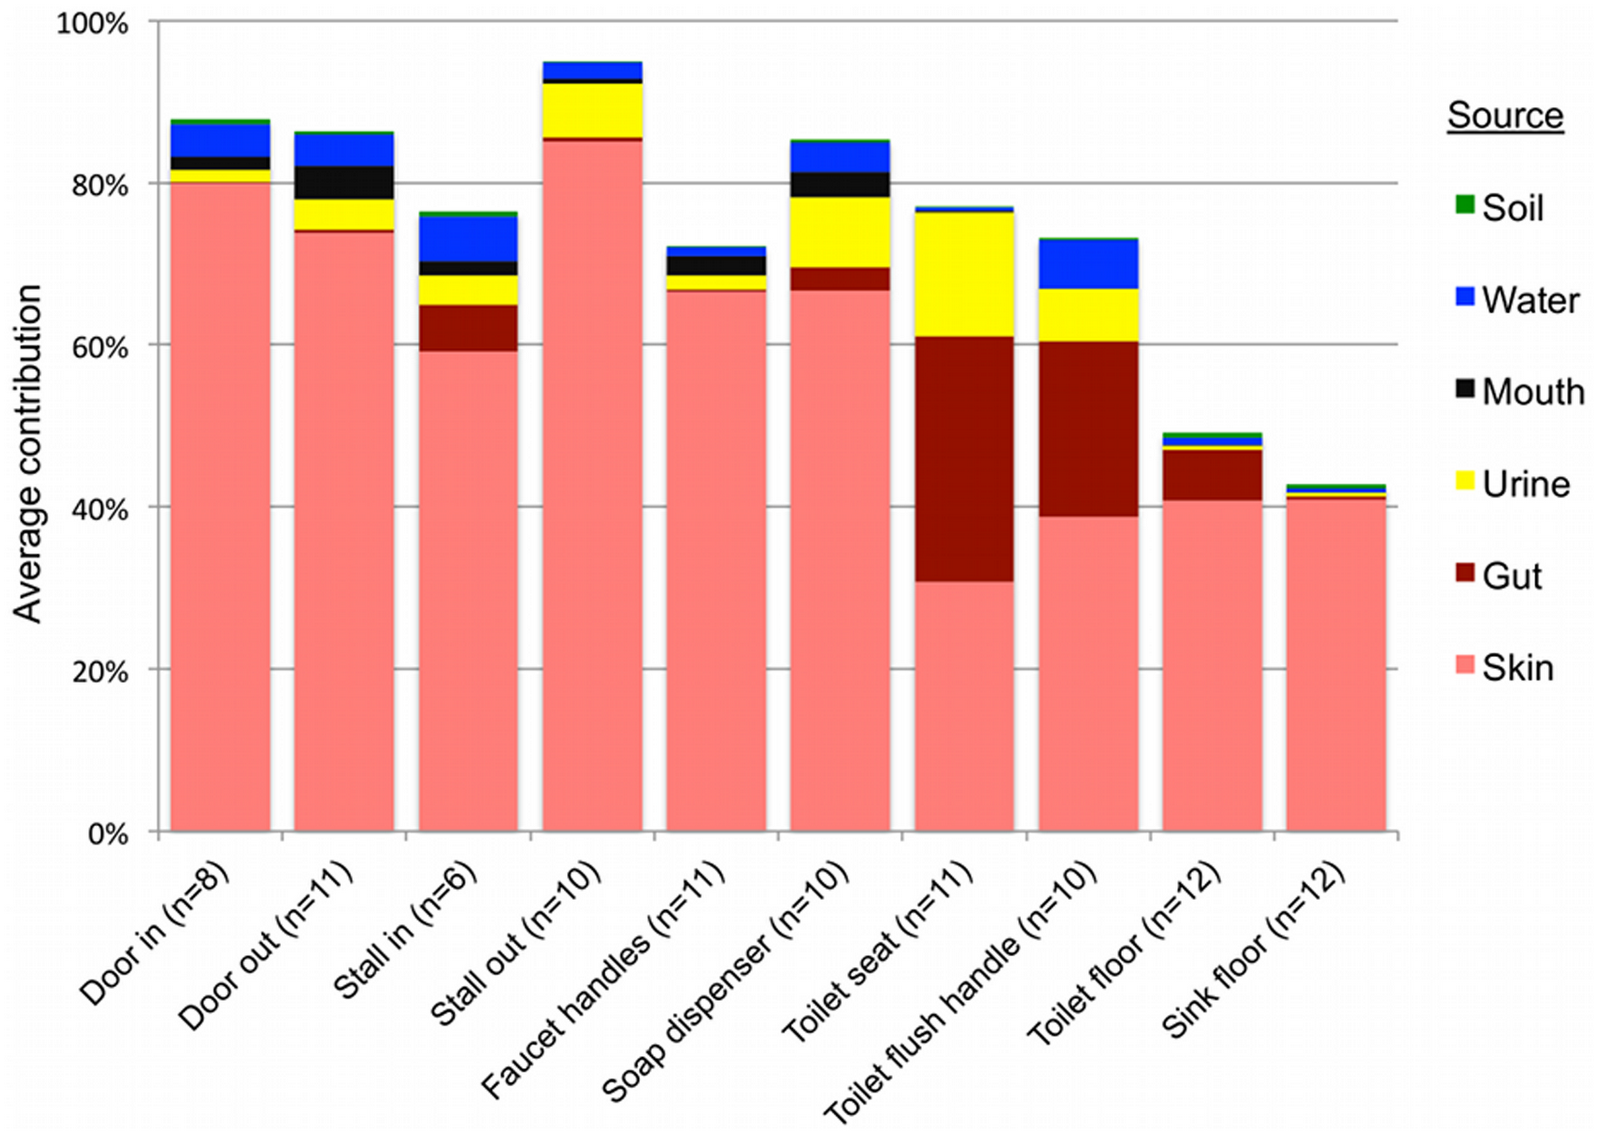
Results of SourceTracker analysis support the taxonomic patterns highlighted above, indicating that human skin was the primary source of bacteria on all public restroom surfaces examined, while the human gut was an important source on or around the toilet, and urine was an important source in women’s restrooms (Figure 4, Table S4). 

Soil not an apparent source:

Contrary to expectations (see above), soil was not identified by the SourceTracker algorithm as being a major source of bacteria on any of the surfaces, including floors (Figure 4). Although the floor samples contained family-level taxa that are common in soil, the SourceTracker algorithm probably underestimates the relative importance of sources, like soils, that contain highly diverse bacterial communities with no dominant OTUs and minimal overlap between those OTUs in the sources and those found in the surface samples. As soils typically have large numbers of OTUs that are rare (i.e. represented by very few sequences) and the OTU overlap between different soil samples is very low [27], it is difficult to identify specific OTUs indicative of a soil source. 

Other potential sources:

The other potential sources we examined, mouth and faucet water, made only minor bacterial contributions to restroom surface communities either because these potential source environments rarely come into contact with restroom surfaces (the mouth – we hope) or they harbor relatively low concentrations of bacteria (faucet water) (Figure 4). While we were able to identify the primary sources for most of the surfaces sampled, many other sources, such as ventilation systems or mops used by the custodial staff, could also be contributing to the restroom surface bacterial communities. More generally, the SourceTracker results demonstrate how direct comparison of bacterial communities from samples of various environment types to those gathered from other settings can be used to determine the relative contribution of that source across samples. Although many of the source-tracking results evident from the restroom surfaces sampled here are somewhat obvious, this may not always be the case in other environments or locations. We could use the same techniques to identify unexpected sources of bacteria from particular environments as was observed recently for outdoor air [44].

Figure 4. Results of SourceTracker analysis showing the average contributions of different sources to the surface-associated bacterial communities in twelve public restrooms.
The “unknown” source is not shown but would bring the total of each sample up to 100%.
doi:10.1371/journal.pone.0028132.g004
Conclusion

While we have known for some time that human-associated bacteria can be readily cultivated from both domestic and public restroom surfaces, little was known about the overall composition of microbial communities associated with public restrooms or the degree to which microbes can be distributed throughout this environment by human activity. The results presented here demonstrate that human-associated bacteria dominate most public restroom surfaces and that distinct patterns of dispersal and community sources can be recognized for microbes associated with these surfaces. Although the methods used here did not provide the degree of phylogenetic resolution to directly identify likely pathogens, the prevalence of gut and skin-associated bacteria throughout the restrooms we surveyed is concerning since enteropathogens or pathogens commonly found on skin (e.g. Staphylococcus aureus) could readily be transmitted between individuals by the touching of restroom surfaces.

Supporting Information Top

Public restroom surfaces sampled and comparison of alpha-diversity metrics for each restroom surface. Note that all alpha-diversity values were determined from 500 randomly selected sequences from each sample.
(DOC)

Average taxonomic composition of bacterial communities associated with female (F) and male (M) public restroom surfaces. Numbers in parentheses indicate the standard error of the mean (SEM). Taxonomy was determined using the RDP-classifier for 500 randomly selected sequences from each sample.
(DOC)

Results of ANOSIM test comparing the bacterial communities associated with male and female restroom surfaces.
(DOC)

Results of SourceTracker analysis showing percentage of microbial community contributions of different source environments to restroom surfaces. Values are the average of ten resamplings with the standard error of the mean reported in parentheses.
(DOC)

Coming Monday at #UCDavis "The Infant Gut Microbiome: Prebiotics, Probiotics, & Establishment"

Just a little announcement here.  There is a symposium tomorrow at UC Davis organized by a undergraduates in the CLIMB program.  CLIMB stands for “Collaborative Learning at the Interface of Mathematics and Biology (CLIMB)” and is a program that emphasizes hands-on training using mathematics and computation to answer state-of-the-art questions in biology.  A select group of undergraduates participate in the program and this summer the students had to do some sort of modelling project.  Somehow I managed to convince them to do work on human gut microbes.  And they have done a remarkable job.

As part of their summer work, they organized a symposium on the topic and their symposium takes place tomorrow.  Details are below.

The Infant Gut Microbiome: Prebiotics, Probiotics, & Establishment

Monday, 12 September 2011, 9am-4pm

Life Sciences 1022

UC Davis

9:00-9:10 Introduction

9:10-9:40 Jonathan Eisen, UC Davis

“DNA and the hidden world of microbes”

9:40-10:40 Mark Underwood, UC Davis

“Dysbiosis and necrotizing enterocolitis”

10:40-10:50 break

10:50-11:50 Ruth Ley, Cornell University

“Host-microbial interactions and metabolic syndrome”

11:50-12:00 general discussion

12:00-1:00 lunch

1:00-2:00 CLIMB 2010 cohort

“Breast milk metabolism and bacterial coexistence in the infant microbiome”

2:00-2:10 break

2:10-3:10 David Relman, Stanford University

“Early days: assembly of the human gut microbiome during childhood”

3:10-3:40 Bruce German, UC Davis

3:40-4:00 next steps

The only major issue for me is I am losing my voice.  So we will see how this goes.  Though I note I have gotten some very sage advice on how to treat my voice problem via the magic of twitter.  If I do not collapse I will also be tweeting/posting about the other talks during the day.


The story behind the story of my new #PLoSOne paper on "Stalking the fourth domain of life" #metagenomics #fb

Well, here goes.

This is a post about a paper that has been a long long time coming. Today, a paper of mine is being published in PLoS One. The paper is titled “Stalking the Fourth Domain in Metagenomic Data: Searching for, Discovering, and Interpreting Novel, Deep Branches in Marker Gene Phylogenetic Trees” and is available at http://dx.plos.org/10.1371/journal.pone.0018011. (or if that link does not work you can get a copy here). This paper represents something I started a long time ago and I am going to try to describe the story behind the paper here.

I note – we are not doing a press release for the paper, for a few reasons. But one of them is that, well, I am starting to hate press releases. So I guess this is kind of my press release. But this will be a bit longer than most press releases. I note – my key fear here is that somehow in my communications with the press or in our text in the paper or in this post I will overstate our findings. Here is the punchline – we found some very phylogenetically novel forms of phylogenetic marker genes in metagenomic data. We do not have a conclusive explanation for the origin of these sequences. They may be from novel viruses. The They may be ancient paralogs of the marker genes. Or they may be from a new branch of cellular organisms in the tree of life, distinct from bacteria, archaea or eukaryotes. I think most likely they are from novel viruses. But we just don’t know.

UPDATE: Am posting some links here to news stories/blogs about our paper


    First – a summary of what we did.

    In the paper, we searched through metagenomic data (sequences from environmental samples) for phylogenetically novel sequences for three standard phylogenetic marker genes (ss-rRNA, recA, rpoB). We focused on sequences from the Venter Global Ocean Sampling data set because, well, we started this analysis many years ago when that was the best data set available (more on this below). What we were looking for were evolutionary lineages of these genes that were separate from the branches that corresponded to the three known “Domains” of life (bacteria, archaea and eukaryotes).

    To search for such novel lineages in the metagenomic data, we built evolutionary trees using these genes where we included sequences from known organisms (and viruses) as well as sequences from metagenomic data. We then looked through the trees for groups that were both phylogenetically novel and included only environmental data (i.e., they were new compared to known organisms or viruses). This method did not work very well for rRNA sequences (largely because making high quality alignments of short phylogenetically novel rRNA sequences was difficult – more on this below). But with RecA and RpoB homologs we were able to generate what we believe to be robust phylogenetic trees. And in these trees we found evidence for phylogenetically very novel sequences in environmental data.

    Figure 1. Phylogenetic tree of the RecA superfamily. 

    Figure 3. Phylogenetic tree of the RpoB superfamily

    We then propose and discuss four potential mechanisms that could lead to the existence of such evolutionarily novel sequences. The two we consider most likely are the following

    1. The sequences could be from novel viruses
    2. The sequences could be from a fourth major branch on the tree of life

    Unfortunately, we do not actually know what is the source of these sequences. So we cannot determine which of the theories is correct. Obviously if there is a novel lineages of cellular organisms out there, well, that would be cool. But we have no evidence right now if that is what is going on. Personally, I think it is most likely that these novel sequences are from weird viruses. But as far as we can tell, they truly could be from a fourth major branch of cellular organisms and thus even though we did not have the story completely pinned down, we decided to finally write up the paper to get other people to think about this issue.

    Below I give all sorts of other details about the project in the following areas

    • The history of the project 
    • More detail on what is in the paper 
    • Follow up analysis and rapid posting with google Know 
    • Data deposition in Dryad 
    • Who was involved 
    • UPDATE: Funding for this work


    The history of the project

    Well, this is one of those projects for which the history is hard to explain. We started this work in 2004 when I was helping Venter and colleagues analyze the Sargasso Sea metagenome data. I was working at TIGR in 2003, which are the time was a sister institute to some of the institutes affiliated with the J. Craig Venter Institute (JCVI) (it was a complicated time). Craig had led a project to do a massive amount of shotgun sequencing of DNA isolated from the Sargasso Sea, which had been the site of many previous studies of uncultured microbes. And Craig, as well as some of the people working with him including John Heidelberg who was at TIGR, had asked me to help in analysis of the data. So I eventually went to a meeting about the project and got involved. It was quite exciting and I put a lot of effort into helping analyze the data.

    As part of my work on the project, I and Martin Wu and Dongying Wu did a variety of phylogenetic studies of genes and gene families. One of these, was a phylogenetic analysis of proteorhodopsin homologs showing massively more diversity in the Sargasso data than in the PCR experiments done by Delong and Beja and others.

    Figure 7 from Venter et al. 2004. 

    We also did the first “phylotyping” in metagenomic data using genes other than rRNA. We built trees of bacterial ss-rRNAs, RecAs, RpoBs, HSP70s, EF-Tus and EF-Gs and then assigned each sequence to a phylum from the trees. In this analysis we found a variety of interesting things. 

    Figure 6 from Venter et al. 2004. 
    One thing I did not include in the Sargasso paper was an analysis I did of RecA homologs where I tried to include ALL RecA-like genes from bacteria, archaea, eukaryotes and viruses. The trees I made were a bit unusual but I was not sure that the alignments I had made were robust or that I had found all the RecA-like genes of interest so I did not even show this to Craig et al. at the time.
    UPDATE: I note – our work on this project was supported by a grant from the NSF Assembling the Tree of Life program that was awarded to me and Naomi Ward and Karen Nelson. Those funds supported the development of many of the informatics tools we used in this analysis and Martin and Dongying were both working on that project.

    After the Sargasso paper was published in 2004 though, I continued to fester about the RecA trees. And I wondered – if instead of trying to classify bacterial sequences into phyla, what if I tried to look for RecAs, rRNAs and other genes that were completely new branches in the tree of life? I got the chance to start to play with this concept again when Venter and crew asked me to help analyze the data coming out of the Global Ocean Sampling project. Again, this project was very exciting and interesting.


    As part of the project, I helped Shibu Yooseph and others look into whether the GOS data revealed any completely new types of functionally interesting genes, much like I had shown for proteorhodopsin in the Sargasso data.  


    Figure 7 from Yooseph et al. 2007 . Phylogenies Illustrating the Diversity Added by GOS Data to Known Families That We Examined 


    And again my mind started wandering towards the question of “OK – so – if there are all these very unusual and novel functionally interesting genes, what about looking for unusual and very novel phylogenetic marker genes”? So finally, I got back to work on the issue.

    And so I built a better RecA tree by first pulling out all possible homologs of RecA and RecA like proteins from the GOS data and then building an alignment and a tree. And there they were. Some very f*%&$ novel RecAs – distinct from any previously known RecA like proteins as far as I could tell. And so with help from Dongying and the JCVI crew, we started building a story about novel RecAs. And then we looked at RpoBs. And found novel ones too. And in mid 2006 while Shibu and Doug worked on their papers that were to be submitted to PLoS Biology and I worked on a review paper too, I told Emma Hill (who has since changed her name to Emma Ganley due to some sort of wedding thing) at PLoS Biology about the an analysis that was consistent with the existence of a fourth domain of life. No overstating our findings really – just that we found very novel phylogenetic marker genes. And that I was working on a paper on it. But alas I never got it done, though I was happy to have convinced Venter to send the GOS papers to PLoS Biology and I think the papers that came out were good. Among the papers were my review (Environmental Shotgun Sequencing: Its Potential and Challenges for Studying the Hidden World of Microbes, Doug Rusch’s diversity paper The Sorcerer II Global Ocean Sampling Expedition: Northwest Atlantic through Eastern Tropical Pacific and Shibu’s protein family paper The Sorcerer II Global Ocean Sampling Expedition: Expanding the Universe of Protein Families as well as many others as part of the Ocean Metagenomics Collection at PLoS.

    And in the midst of all of this, we had our first child and we wanted to move back to Northern California to be closer to family (my wife’s family is all in the Bay Area and my sister and brother Michael were in N. Cal too). So I applied for jobs and eventually took at job at UC Davis and we moved to Davis. Needless to say, all of that put a bit of a crimp in my work productivity. And once I was up and running at Davis, it just took a long time to get back to the searching for novel deep branches in the tree of life. But finally, we did it (with periodic prodding from Craig Venter). And we put together a paper and got it submitted to PLoS One in October. The reviews were very positive and enormously helpful. And we finally got a revision in January and it was officially accepted in February 2011. Only some seven years after my first work on the project. Whew.

    More detail of what is in the paper
    Well, I am going to be posting here some additional detail on what is in the paper.


    Why we punted on analysis of very novel rRNAs.

    The problem with rRNA is that the sequences that come from environmental samples are not complete (i.e. they only correspond to portions of the rRNA genes). Unfortunately, this makes a key step in phylogenetic analysis difficult – the alignment of sequences. We actually found about 200 rRNA sequences that seemed unusual in a phylogenetic sense. However, we were not convinced that the alignments of these fragments to other rRNAs was robust. This is because the alignment of rRNAs is best done making use of the base pairing secondary structure of the molecule and not the base sequence (i.e., primary structure).

    With only rRNA fragments, we could not use the secondary structure to do the alignments because you need to whole molecule to determine the best folding. Combined with the fact that we were searching for very distantly related ribosomal RNAs which would be hard to align even if we had the whole molecule, we were stuck for a bit. It seemed impossible to look for really novel organisms.
    So that is when we turned to other genes. The key for this is that there are protein coding genes that are universal and that for known organisms show similar patterns to rRNA in trees. In fact, in 1995 I wrote a paper showing that trees of RecA were very similar to trees of rRNA. RpoB is also considered a very robust phylogenetic marker. For organisms that we have in the lab (i.e., cultured) – many people use these other genes for phylogenetic analysis. rRNA has been very important in part because of the ease with which one can PCR amplify it from environmental samples and the fact that it is very hard to PCR amplify protein coding genes from the environment. Metagenomics changes this. With random sequencing, you get data from all genes. This means we can pick and choose genes to analyze for phylogenetic analysis and do not have to rely on rRNA.

    So we went after RecA first, because it has been shown to be a good phylogenetic marker for studies of the tree of life. And we found some very novel branches in the RecA tree. And after analyzing these and convincing ourselves that they were indeed phylogenetically very novel we went after RpoB. And also found very novel branches.

    So the phylogenetic analysis I think is very robust.

    RecA and RpoB as phylogenetic markers

    Many genes have been used as alternatives to rRNA genes to build “Trees of Life” including all organisms. Each has their own flavors of advantages and drawbacks. Two commonly used ones are the RecA and RpoB superfamilies.

    The many possible explanations for finding novel forms of phylogenetic marker genes

    The phylogenetically novel phylogenetic marker genes we found could have many explanations including that they could be ancient paralogs of these genes (but not found in any genomes we have available), they could be from viruses, or they could be from a novel branch on the tree of life. Or our trees could be bad. We think the latter is somewhat unlikely as our analysis has many lines of support. For example our RecA trees are very similar to those from a comprehensive study from M. Nei’s lab except they did not include the metagenomic data. But I guess it is still a possibility that our trees are biased in some way (e.g., by long branch attraction or bad alignments)

    Follow up analysis and rapid posting via Google Knol

    Amazingly and a bit sadly, I think we rushed the paper out. We left out one thing partly by accident – we had done an analysis of the locations from which these novel RecA and RpoB sequences had come. And somehow, in our final push to get the paper out, we left this out. I will be posting this information as soon as possible here and on the PLoS One site.

    In addition, after submitting the revision of our paper, we realized that we might be able to do a deeper analysis on one aspect of the work – how RpoB homologs from unusual DNA viruses compared to our novel sequences. We had included some RpoBs from DNA viruses in our analyses but not all that were available. So Dongying Wu did a very rapid additional analysis, adding some additional RpoB homologs to our alignment and making a tree of them. We then wrote a Google Knol about this new tree and submitted the Knol to PLoS Currents “Tree of Life” where it is currently in review. We are publishing the preprint of this Knol to make it available to all even while it is in review.


    Figure 2 from Wu and Eisen submitted. 

    Data availability

    There is a move afoot to make sure all data/tools associated with publications are readily available. We used publicly available sequence data and as much as possible publicly available tools for our work . We are trying to release as much as possible to allow people to re-analyze our work and to do any of the work themselves. We have therefore made use of the Dryad Data deposition service to post some of this material (see http://datadryad.org/handle/10255/dryad.8385).

    Who was involved

    • Dongying Wu a brilliant “Project Scientist” in my lab led the project (Project Scientist is one of the UC positions that is like what others call “Senior Scientist”). Dongying is simply one of the best bioinformaticians/computational biologists I have ever met. He was first author on many key papers from my lab including the Genomic Encyclopedia paper that came out last year and the glassy winged sharpshooter symbionts paper that came out a few years ago. Dongying worked in my group at TIGR and moved with me to UC Davis and currently splits his time between UC Davis and the DOE Joint Genome Institute. 
    • Martin Wu. Martin is an Assistant Professor at the University of Virginia. Prior to that he was a Project Scientist in my lab at Davis and a post-doc in my lab at TIGR. He is also a phenomenal bioinformatician / computational biologist. He developed the AMPHORA software in my lab and also led many genome projects (back when sequencing a genome was hard …) including that of the first Wolbachia genome and that of a very unusual bug Carboxydothermus hydrogenoformans. Martin helped with some of the genome analyses as part of this work. 
    • Aaron Halpern, Doug Rusch and Shibu Yooseph are all bioinformaticians from the J. Craig Venter Institute (Aaron is no longer there). All three helped with different aspects of dealing with and analyzing the GOS data and all three have been remarkably patient as this work dragged on and on. 
    • Marv Frazier from the JCVI was helpful in the initial set up and conceptualization of the project. 
    • J. Craig Venter is, well, Craig Venter, and he was involved in multiple aspects of the project including thinking about how and where to look for unusual sequences and interpreting some of the results.

    UPDATE: Funding for this work

    Most of my labs early work on this project was supported by a grant we had from the Assembling the Tree of Life program at the National Science Foundation (grant 0228651 to me and Naomi Ward). In that project we were working on sequencing and analyzing genomes from phyla of bacteria for which genomes were not available at the time. As part of this work we were designing methods to build phylogenetic trees from metagenomic data because we thought that our new genomes would be very useful in helping analyze metagenomic reads and figure out from which phyla they came. Later work on the project was supported by a grant to me, Jessica Green and Katie Pollard from the Gordon and Betty Moore Foundation (grant 1660).

    Some questions that might be asked and some answers (based in part on questions I have gotten from reporters). Note if you have other questions please post them here or on the PLOS One site for the paper.

    • Why no press release? Well, in part, because I sent information too late (shocking I know) to the Davis Press Office. But also because they have gotten suddenly busy with some Japan earthquake related actions. But also because, well, I really hate a lot of press releases. And finally, my brother had dinner with Carl Zimmer recently and apparently they discussed the possibility of having no press releases associated with papers. So here goes …. 
    • Really – what took so long? I would like to say the US Government made us hold back on publishing this until they could look into whether Venter collected ocean data from Roswell, NM or not. But really, the story above is true. We just did not get it done earlier. 
    • Why do you not know the source of the DNA (i.e., cells, viruses, etc)? This is why there was a six year wait between discovery and writing this up. We kept thinking we would be able to find the organisms but since I moved from TIGR and started a new job, we just never got around to getting to the source. We therefore decided to open this up to others who will hunt for the source by writing up the paper. 
    • Why did you not rename the Unknown 2 group in the RecA tree? We should have renamed our group “Thaumarchaeota” or something like that. When we did the initial analysis our group was novel. And then a few years ago a few groups obtained data from what is thought to be the third major lineage of Archaea – referred to by some as Thaumarchaeota. This is to go with the Euryarchaeota and Crenarchaeota. See http://www.ncbi.nlm.nih.gov/pubmed/20598889 for example. 
    • One of the clades in the RecA tree (XRCC2) seems out of place phylogenetically. I can see how that is confusing. The XRCC2 clade is very weird and hard to figure out. It is not the “normal” eukaryotic genes – those are the Rad51/DMC1 genes. One complication with the RecA family is that there have been duplication events to go with the species evolution. And thus eukaryotes have Rad51, DMC1, Rad51B, Rad51C, Rad57, XRCC3 and XRCC2. We tried to figure out where the XRCC2 group should go but it just was hard to place. The statistical support for its position (we used a method called bootstrapping) is low (note the lack of a number on the node where the branch leading to XRCC2 connects to the base of the tree). Most likely that group should be placed with some of the other eukaryotic groups. However, it seems likely that there was a duplication in the lineage leading up to the ancestor of eukaryotes and archaea (some studies have indicated they share a common ancestor to the exclusion of bacteria). Such a duplication would explain why basically all archaea have a RadA and and RadB and all / most eukaryotes have multiple paralogs as well. 
    • The Unknown 1 group in the RpoB RecA tree seems to group with phage. What can you say about that? We think unknown 1 is potentially of viral origin but still cannot tell. The fact that is clusters with RecA superfamily members from phage suggests this but it is distant enough from known phage for us to not be confident in any predicted origin. As for derivative forms vs. independent branch – this is one of the big questions about viruses these days. Many viruses encode homologs of “housekeeping” genes found across bacteria, archaea and eukaryotes. And in many cases the viral versions of these genes appear to phylogenetically very novel. This is why the people studying mimivirus (which we refer to) suggest some viruses may in fact represent a fourth branch on the tree of life. It is possible that some viruses are in fact reduced forms of what were once cellular organisms – akin to parasitic intracellular species of bacteria possibly. 
    • Why are these phylogenetically novel sequences so low in abundance? This is a key question. I think it would be easy to come up with a theory for these being rare or these being common. They might be rare if their niche is very limited today. Or they might be rare because they could not be very competitive with other organisms. Or they could be rare because they require some unusual interactions with other taxa. In addition, we have only looked carefully at ocean water samples. If these are common somewhere else (e.g., hotsprings, deep subsurface, etc) we would not yet have figured that out. We are looking at additional metagenomic data right now to see fi we can find any locations where relatives of these genes are more common

    Some related papers by others worth looking at

    Some related papers by me possibly worth looking at

    Some related blog posts I have written over the years

      http://friendfeed.com/treeoflife/5535e8ed/story-behind-of-my-new-plosone-paper-on-stalking?embed=1

      Dongying Wu, Martin Wu, Aaron Halpern, Douglas B. Rusch, Shibu Yooseph, Marvin Frazier,, & J. Craig Venter, Jonathan A. Eisen (2011). Stalking the Fourth Domain in Metagenomic Data: Searching for, Discovering, and Interpreting Novel, Deep Branches in Marker Gene Phylogenetic Trees PLoS One, 6 (3) : 10.1371/journal.pone.0018011

      Norman R. Pace visit to #UCDavis; discussing microbiology of the built environment #microBEnet

      Norman R. Pace, from UC Boulder, gave a talk at UC Davis last week about microbial diversity.  In his talk he discussed some of his recent Sloan Foundation funded work on “microbiology of the built environment” including studies of shower heads, indoor swimming pools, water supplies, and hospitals.

      Pace is one of the pioneers of DNA based studies of microbes in the environment.  His initial work on studies of ribosomal RNA from uncultured organisms (started more than 20 years ago) helped launch the field.  For more information on his work see his lab page here

      If you are interested in the microbes that are found in showerheads, his PNAS paper on this (which can be found here) on this from 2 years ago got a lot of press.  See for example this Science Friday
      and this New York Times article by Nicholas Wade.

      Pace was at UC Davis as part of the Storer Major Issues in Modern Biology Lecture Series.

      I note, I have written about Pace before a few times including this:
      Here’s hoping molecular classification/systematics of cultured & uncultured microbes wins #NobelPrize in medicine

      I note we have a new project as part of this Sloan program to facilitate communication and networking and sharing information as part of this project.  My lab is creating something called “microBEnet” – the microbiology of the built environment network.  We are just getting our real site up and running.  For now you can find out some information at a temporary page http://microbenet.blogspot.com/

      Phylogeny rules:


      I am a coauthor on a new paper in PLoS Computational Biology I thought I would promote here.  The full citation for the paper is:

      The paper discusses a new software program “phylOTU” which is for phylogenetic-based identification of “operational taxonomic units”, which are also known as OTUs.   What are OTUs?  They are basically clusters of closely related sequences that are used to represent something akin to a species.  OTUs are used a lot in environmental microbiology b/c one key way to study microbes in the environment is through extraction and sequencing of DNA.  Traditionally this has been done through PCR amplification and sequencing of one particular gene (ss-rRNA).  Now it is also being done through random sequencing of all DNA from environmental samples (so called metagenomics).

      Anyway – the paper is (of course) fully open access and you can read it for more detail.  Just thought I would post a little here about it.  The paper / project was led by Tom Sharpton, a post doc in Katie Pollard‘s lab at UCSF working on a collaborative project between Katie’s lab, my lab, and Jessica Green‘s lab at U. Oregon (and recently Martin Wu’s new lab at U. Virginia – he was in my lab previously).  This collaborative project even has a name “iSEEM” which stands for integrating statistical, evolutionary and ecological approaches to metagenomics.  This project has been generously supported by the Gordon and Betty Moore Foundation (via a grant for which I am PI).


      Some little tidbits of possible interest about the project

      Sharpton, T., Riesenfeld, S., Kembel, S., Ladau, J., O’Dwyer, J., Green, J., Eisen, J., & Pollard, K. (2011). PhylOTU: A High-Throughput Procedure Quantifies Microbial Community Diversity and Resolves Novel Taxa from Metagenomic Data PLoS Computational Biology, 7 (1) DOI: 10.1371/journal.pcbi.1001061

      Here’s hoping molecular classification/systematics of cultured & uncultured microbes wins #NobelPrize in medicine

      From Wu et al. 2009. A phylogeny driven genomic encyclopedia of bacteria and archaea. Nature 462, 1056-1060 doi:10.1038/nature08656  http://bit.ly/8Y8xea

      Well, I am always hopeful.  Every year when the Nobel Prizes come around I am alway hoping that one of them goes to someone involved in studying microbial diversity in some way.  And really, there is a potential Nobel Prize in Physiology or Medicine out there in this area.  Sure they do not give out a Nobel in biology, or evolution or ecology.  But I think a good argument could be made for giving out a Nobel Prize in Physiology or Medicine to those who have worked on molecular systematics of cultured and uncultured microbes.

      Why should this attract the attention of those giving out the Nobel Prizes?  Well, without molecular systematics of microbes we would be completely lost in a sea of microbial diversity.  And with such molecular systematics we can not only make much more sense out of the biology of cultured organisms, but we can go to environments and determine who is out there by sampling their genes.  And this type of work has undoubtedly revolutionized medicine, from determining what antibiotics are most likely to be useful in infections, to tracking emerging infectious diseases, to studying the vast diversity of microbes we have not yet cultured in the lab.  Certainly with the growing importance of the human microbiome in medical studies and the growing application of molecular systematics (e.g., rRNA surveys) to all sorts of aspects of microbiology, the time is ripe for an award in this area.

      And who would get an award if one was given.  Well, certainly one of the people should be Carl Woese, who pioneered the use of comparative analysis of the sequences of rRNA genes to the study of systematics of microbes.  Woese of course was responsible for proposing the existence of a third branch in the tree of life – the archaea.  And even if you do not personally believe that the “three domain” tree of life is perfectly correct, Woese and colleagues (e.g., George Fox, who was a coauthor on some of the pioneering papers) were responsible for making microbial systematics a much more rigorous science than it had been.

      And I think a good argument could be made for including Norm Pace in this Nobel as he was the one mostly responsible for pushing the sequencing and analysis of rRNA genes for studying microbes in the environment (though I note, others like Mitch Sogin also helped pioneer this field).  There is a direct path from Woese through Pace to much of modern molecular studies of microbes in the environment, including the latest approach – metagenomics.  In fact, there has even been a Nobel Prize already given that depended on much of this work – the one in 2005 to Barry Marshall and Robin Warren for discovery of the role of Helicobacteri pylori in causing stomach ulcers.

      Anyway – just a short post about this – maybe more later.  But I sincerely think this would be a well deserved area in which to hand out one of those Nobel Prizes.  Not holding my breath, but always hopeful.

      Here some potentially related things that I have written that may be useful to read:

      #PLoSOne paper keywords revealing: (#Penis #Microbiome #Circumcision #HIV); press release misleading

      UPDATE – READ COMMENTS – LEAD AUTHOR HAS GOTTEN PRESS RELEASE CHANGED

      A new paper just showed up on PLoS One and it has some serious potential to be important The paper (PLoS ONE: The Effects of Circumcision on the Penis Microbiome) reports on analyses that show differences in the microbiota (which they call the microbiome – basically what bacterial species were present) in men before and after circumcision. And they found some significant differences. It is a nice study of a relatively poorly examined subject – the bacteria found on the penis w/ and w/o circumcision. This is a particularly important topic in light of other studies that have shown that circumcision may provide some protection against HIV infection.

      In summary here is what they did – take samples from men before and after circumcision. Isolate DNA. Run PCR amplification reactions to amplify variable regions of rRNA genes from these samples. Then conduct 454 sequencing of these amplified products. And then analyze the sequences to look at the types and #s of different kinds of bacteria.

      What they found is basically summarized in their last paragraph

      “This study is the first molecular assessment of the bacterial diversity in the male genital mucosa. The observed decrease in anaerobic bacteria after circumcision may be related to the elimination of anoxic microenvironments under the foreskin. Detection of these anaerobic genera in other human infectious and inflammatory pathologies suggests that they may mediate genital mucosal inflammation or co-infections in the uncircumcised state. Hence, the decrease in these anaerobic bacteria after circumcision may complement the loss of the foreskin inner mucosa to reduce the number of activated Langerhans cells near the genital mucosal surface and possibly the risk of HIV acquisition in circumcised men.”

      And this all sounds interesting and the work seems solid. I note that some friends / colleagues of mine were involved in this including Jacques Ravel who used to be at TIGR and now is at U MD and Paul Kiem who is associated with TGen in Arizona. For anyone interested in HIV, the human microbiome, circumcision, etc, it is probably worth looking at.

      However, the press release I just saw from TGen really ticked me off. The title alone did me in “Study suggests why circumcised men are less likely to become infected with HIV”. Sure the study did suggest a possible explanation for why circumcised men are less likely to get HIV infections – the paper was justifiably VERY cautious about this inference. They basically state that there are some correlations worth following up.

      The press release goes on to say “The study … could lead to new non-surgical HIV preventative strategies for the estimated 70 percent of men worldwide (more than 2 billion) who, because of religious or cultural beliefs, or logistic or financial barriers, are not likely to become circumcised.” Well sure, I guess you could say that. I think they are iplying you could change the microbiome somehow and therefore protect from HIV but that implies (1) that there really is a causal relationship between the microbial differences in HIV protection and (2) that one could change the microbiome easily, which is a big big stretch given how little we know right now.

      Anyway – the science seems fine and not over-reaching. But the press release is annoying and misleading. Shocking I know. But this one got to me.

      UPDATE – SEE COMMENTS HERE AND IN FRIENDFEED. LEAD AUTHOR GOT PRESS RELEASE CHANGED.

      ResearchBlogging.org

      Price, L., Liu, C., Johnson, K., Aziz, M., Lau, M., Bowers, J., Ravel, J., Keim, P., Serwadda, D., Wawer, M., & Gray, R. (2010). The Effects of Circumcision on the Penis Microbiome PLoS ONE, 5 (1) DOI: 10.1371/journal.pone.0008422

      My first PLoS One paper …. yay: automated phylogenetic tree based rRNA analysis

      ResearchBlogging.org
      Well, I have truly entered the modern world. My first PLoS One paper has just come out. It is entitled “An Automated Phylogenetic Tree-Based Small Subunit rRNA Taxonomy and Alignment Pipeline (STAP)” and well, it describes automated software for analyzing rRNA sequences that are generated as part of microbial diversity studies. The main goal behind this was to keep up with the massive amounts of rRNA sequences we and others could generate in the lab and to develop a tool that would remove the need for “manual” work in analyzing rRNAs.

      The work was done primarily by Dongying Wu, a Project Scientist in my lab with assistance from a Amber Hartman, who is a PhD student in my lab. Naomi Ward, who was on the faculty at TIGR and is now at Wyoming, and I helped guide the development and testing of the software.

      We first developed this pipeline/software in conjunction with analyzing the rRNA sequences that were part of the Sargasso Sea metagenome and results from the word was in the Venter et al. Sargasso paper. We then used the pipeline and continued to refine it as part of a variety of studies including a paper by Kevin Penn et al on coral associated microbes. Kevin was working as a technician for me and Naomi and is now a PhD student at Scripps Institute of Oceanography. We also had some input from various scientists we were working with on rRNA analyses, especially Jen Hughes Martiny

      We made a series of further refinements and worked with people like Saul Kravitz from the Venter Institute and the CAMERA metagenomics database to make sure that the software could be run outside of my lab. And then we finally got around to writing up a paper …. and now it is out.

      You can download the software here. The basics of the software are summarized below: (see flow chart too).

      • Stage 1: Domain Analysis
        • Take a rRNA sequence
        • blast it against a database of representative rRNAs from all lines of life
        • use the blast results to help choose sequences to use to make a multiple sequence alignment
        • infer a phylogenetic tree from the alignment
        • assign the sequence to a domain of life (bacteria, archaea, eukaryotes)

      • Stage 2: First pass alignment and tree within domain
        • take the same rRNA sequence
        • blast against a database of rRNAs from within the domain of interest
        • use the blast results to help choose sequences for a multiple alignment
        • infer a phylogenetic tree from the alignment
        • assign the sequence to a taxonomic group

      • Stage 3: Second pass alignment and tree within domain
        • extract sequences from members of the putative taxonomic group (as well as some others to balance the diversity)
        • make a multiple sequence alignment
        • infer a phylogenetic tree

      From the above path, we end up with an alignment, which is useful for things such as counting number of species in a sample as well as a tree which is useful for determining what types of organisms are in the sample.

      I note – the key is that it is completely automated and can be run on a single machine or a cluster and produces comparable results to manual methods. In the long run we plan to connect this to other software and other labs develop to build a metagenomics and microbial diversity workflow that will help in the processing of massive amounts of sequence data for microbial diversity studies.

      I should note this work was supported primarily by a National Science Foundation grant to me and Naomi Ward as part of their “Assembling the Tree of Life” Program (Grant No. 0228651). Some final work on the project was funded by the Gordon and Betty Moore Foundation through grant #1660 to Jonathan Eisen and the CAMERA grant to UCSD.

      Wu, D., Hartman, A., Ward, N., & Eisen, J. (2008). An Automated Phylogenetic Tree-Based Small Subunit rRNA Taxonomy and Alignment Pipeline (STAP) PLoS ONE, 3 (7) DOI: 10.1371/journal.pone.0002566

      Retraction – I was buzzing off about bees before my time

      Recently I wrote a post about the recent study on bees associated with colony collapse disorder. After receiving a well thought out email from one of the authors on the study I have decided to retract my blog and apologize to the authors of the bee study. I rushed out my blog without really considering the evidence and the data very carefully and accept that I screwed this one up big time. The study is much more complex and comprehensive that I led people to believe. In part this was due to lack of detail in the actual manuscript but alas most of the fault lies with me – in not trying to contact the authors for more detail before mouthing off.

      So I am giving myself a new award – the genomic jerk award. Hopefully there will be no more recipients.