This is fun. Today I am posting this guest post from
Corey Nislow in my continuing “
Story behind the paper” series. The history of this post is what is most fun for me. A few weeks ago I received this email from Corey:
Hi Jonathan, I hope this mail finds you well.
I wanted to alert you to a study from our lab that will be coming out in the inaugural issue of eLIFE.
After reading your PLoS ONE paper on the Haloferax volcanii genome (inspiration #1) I ordered the critter, prepared nucleosomes and RNA and we went mapping. Without a student to burden, I actually had to do some work…
Anyhow, we found that the genome-wide pattern of nucleosome occupancy and its relation to gene expression was remarkably yeast like. Unsure of where to send the story, we rolled the dice with the new open access journal eLIFE (inspiration #2) and the experience was awesome. I’m quite keen to pursue generating a barcoded deletion set for Hfx.
here’s the paper (coming out Dec. 10) if you’re curious.
And a PDF of the paper was attached.
And I wrote back quickly in my typically elegant manner:
completely awesome
But then I thought better of it and wrote again
So – can I con you into writing a guest post for my blog about the story behind this paper? Or if you are writing a description somewhere else I would love to share it
And he said, well, yes. And with a little back and forth, he wrote up the post that it below. Go halophiles. Go Haloferax. Go open access. Go science.
Chromatin is an ancient innovation conserved between Archaea and Eukarya – The story behind the story
By Corey Nislow
My group first became interested in understanding the global organization of chromatin in early 2005 when Lars Steinmetz (now program leader at the EMBL) led a team effort at the Stanford Genome Center to design a state-of-the-art whole genome tiling microarray for Saccharomyces cerevisiae. These were heady times at Ron Davis’ Genome Technology shop and the array was another triumph of technology and teamwork. The array has over 7 million exceedingly small (5 µm²). The history of how this microarray transformed our understanding of the transcriptome began in 2006. As Lars’ group dug deeper, the extent of antisense transcription and its role in the regulation of expression became clear.
The availability of this array and its potential for asking interesting questions inspired me to convince William Lee, a new graduate student in my group (now at Memorial Sloan-Kettering) to embark on a seemingly simple experiment. The idea was to ask if we could use the classic micrococcal nuclease assay to define nucleosome positioning on a DNA template. But rather than using a short stretch of DNA that could be assessed by radioactive end-labeling and slab gel analysis, we decided the time was right to go “full-genome”. Accordingly, the template was all ~12.5mB of the yeast genome. Will systematically worked out conditions appropriate for hybridization, wrote the software to extract signal off the array (we were flying blind as the array did not come with an instruction manual) and producing an output that was compatible with the genome browsers of the time. Will’s computational background proved critical here (and at several later stages of the project). The result of this experiment was a map of the yeast genome with each of its approximately 70,000 nucleosome’s charted with respect to their occupancy (the length of time that the nucleosomes spend in contact with the DNA) and positioning (the location of a particular nucleosome relative to specific sequence coordinates) in a logarithmically growing population of cells (the paper). Both occupancy and positioning regulate access of most trans-acting factors for all DNA transactions. Working with my new colleague Tim Hughes at the University of Toronto, we began to mine this data focusing first on how the diverse occupancy patterns correlated with aspects of transcription, e.g. the presence of transcription factor binding sites, the level of expression of particular genes, and the like. With this data for the entire genome, we could systematically correlate nucleosome positioning/occupancy with functional elements, sequence logos and structural features. Des Tillo, a graduate student in Tim’s lab and now a research fellow with Eran Segal, was able to build a model that could predict nucleosome occupancy. The correlation (R=0.45) was not great but it was miles better than anything that existed at the time. Tim and Eran’s labs, work with Jason Lieb and Jonathan Widom, refined the model to greater accuracy 2009 model.
Our original study (essentially a control experiment to define the benchmark nucleosome map in yeast) has been widely cited- many of these cites have come from what were two opposing camps, the sequence advocates and the trans-acting proponents. The sequence folks posed that nucleosome position is directed by the underlying sequence information while the trans-acting folks see chromatin remodelers as having the primary role. Having last worked on chromatin in 1995 as a postdoc in Lorraine Pillus’ lab (cloning yeast SET1), it has been a scientific treat to be both a participant and observer in this most recent renaissance of chromatin glory.
The protocol
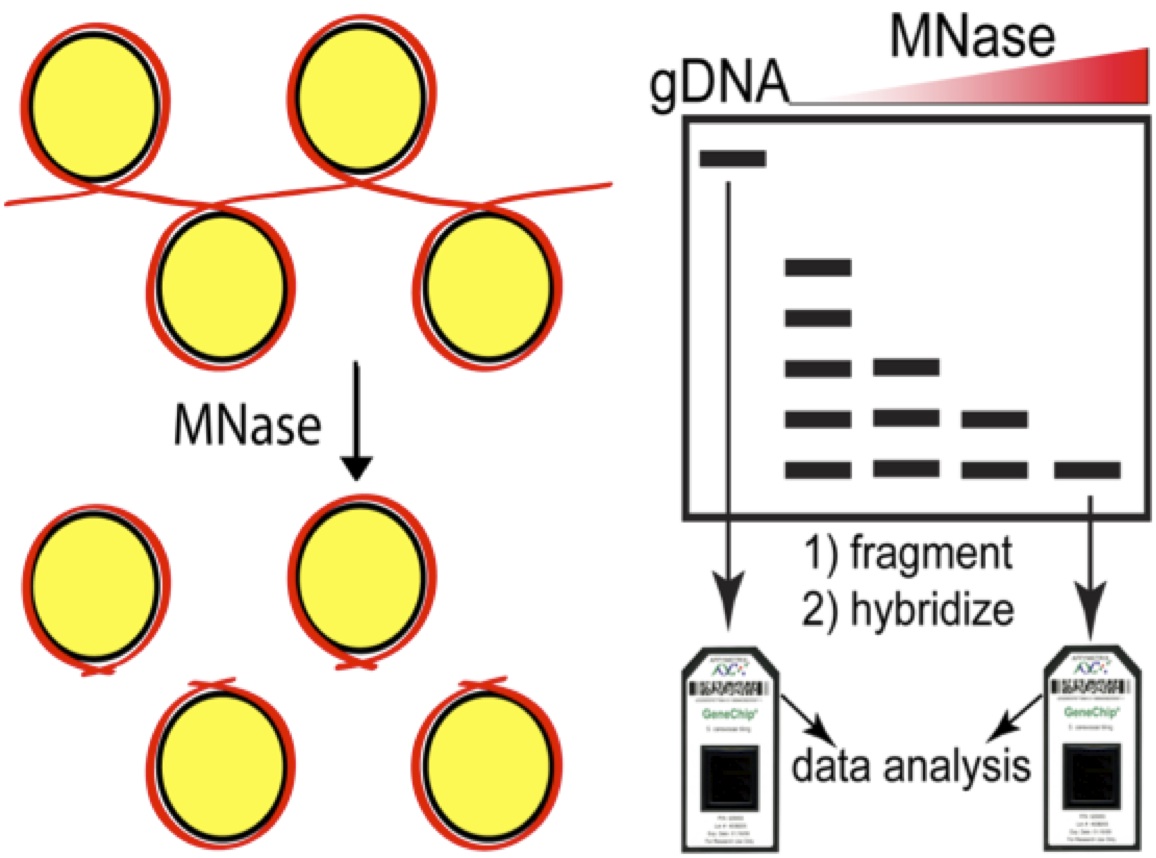
As a reminder, the micrococcal nuclease (MNase) assay relies on the preference of this nuclease to digest linker DNA. By chemically crosslinking histones to DNA with formaldehyde, digesting with MNase, then reversing the crosslinks and deproteinizing the DNA, you obtain 2 populations of DNAs, those protected by digestion (and presumably wrapped around nucleosomes in vivo) and a control sample that is crosslinked but not digested (genomic DNA). The former sample becomes the numerator and the latter the denominator and you take the ration between the two. Initially we compared the microarray signal intensities, now next generation sequence counts are used to define nucleosomal DNA. This cartoon depicts the array based assay, but simply swap in an NGS library step for the arrays to upgrade to the current state-of-the-art. 

In 2007 we were restricted to array-based assays (as were most genomic studies) and frankly, the 4bp resolution of the arrays was pretty amazing. But the introduction of Next-generation sequencing opened up the possibility of charting nucleosomes in worms or wildebeest or almonds, there was nothing to stop you other than the short read lengths at the time. The read length issue has since disappeared as the “short-read” platforms can easily cover the length of a nucleosome protected DNA fragment of ~150bases.
So that brings me to the paper I’d like to highlight today, which asks the question: if (and how) chromatin is organized in the archae, and further, is there any correlation of archae chromatin architecture to gene expression?
My extreme background
Just like the universal fascination of kids with dinosaurs, I was captivated by the discovery of life in extreme environments like boiling water or in acid that could melt flesh on contact. Teaching intro bio, I would try to provoke the students by claiming that discovering extraterrestrial life will be a letdown compared to what we can find on earth. So while my students were occupied with classifying yeast nucleosome and transcriptome profiles in different mutants and drug conditions, I had the rare opportunity to indulge my curiosity. Jonathan E’s talks on the dearth of information on microbes, combined with my re-discovery of the early papers from Reeve and Sandman (see review) had me hooked. Reading the literature was like discovering the existence of a parallel chromatin universe. Archae histone complexes were tetramers (as opposed to the octamers of eukaryotic nucleosome core particles) but most everything else was similar- they wrapped DNA (60-80 bases compared to 147 for yeast) and although archael histones did not share primary sequence similarity to eukaryotic nucleosomes, at the structural level they resembled histone H3 and H4 in eukaryotes.
Working from ignorance
Choosing the particular archaeon to study was dictated by one criterion, the ability to grow it in the lab easily without resorting to anaerobic conditions or similar calisthenics. Again, I was fortunate in that the halophilic arcaeon Haloferax volcanii fit the bill, but more importantly, there was a wealth of literature on this critter, including a well-annoted genome (thanks again Jonathan!) and an impressive armamentarium of genomic tools. Indeed the work of Allers, Mevarech and Lloyd and others have established Hfx. volcanii as a bona fide model organism with excellent transformation gene deletion gene tagging and gene expression tools.

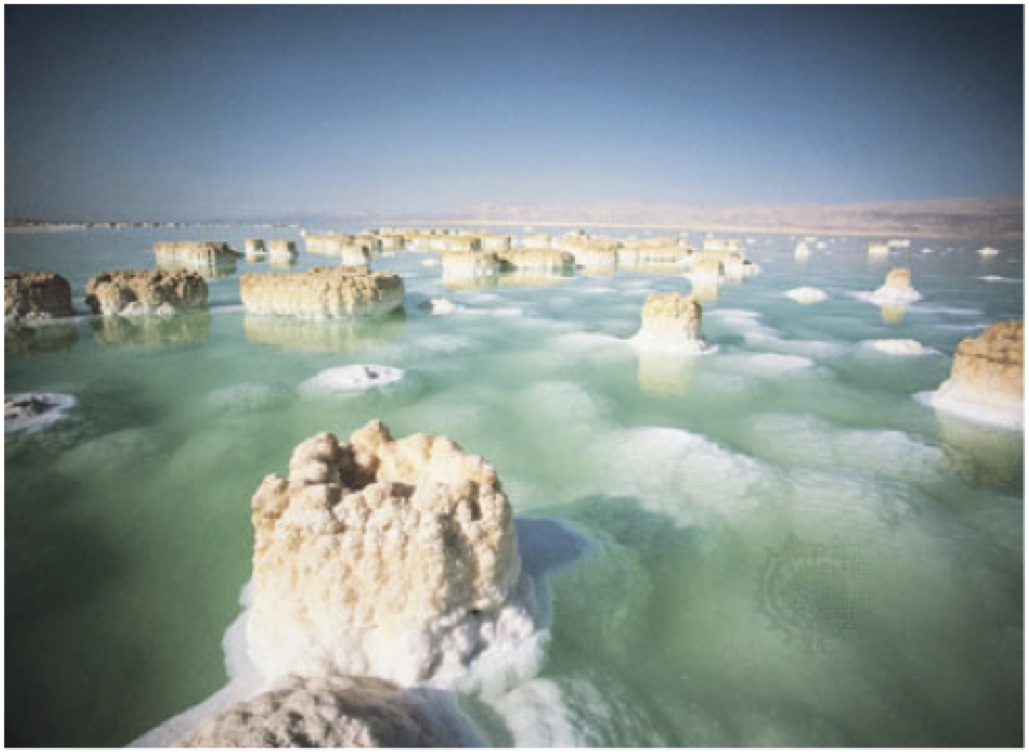
Home for Haloferax volcanii.
 |
| This photograph shows salt pillars that form in the dead sea which borders Jordan to the east and Israel and the West Bank to the west. The salt concentration in the water can exceed 5M! |
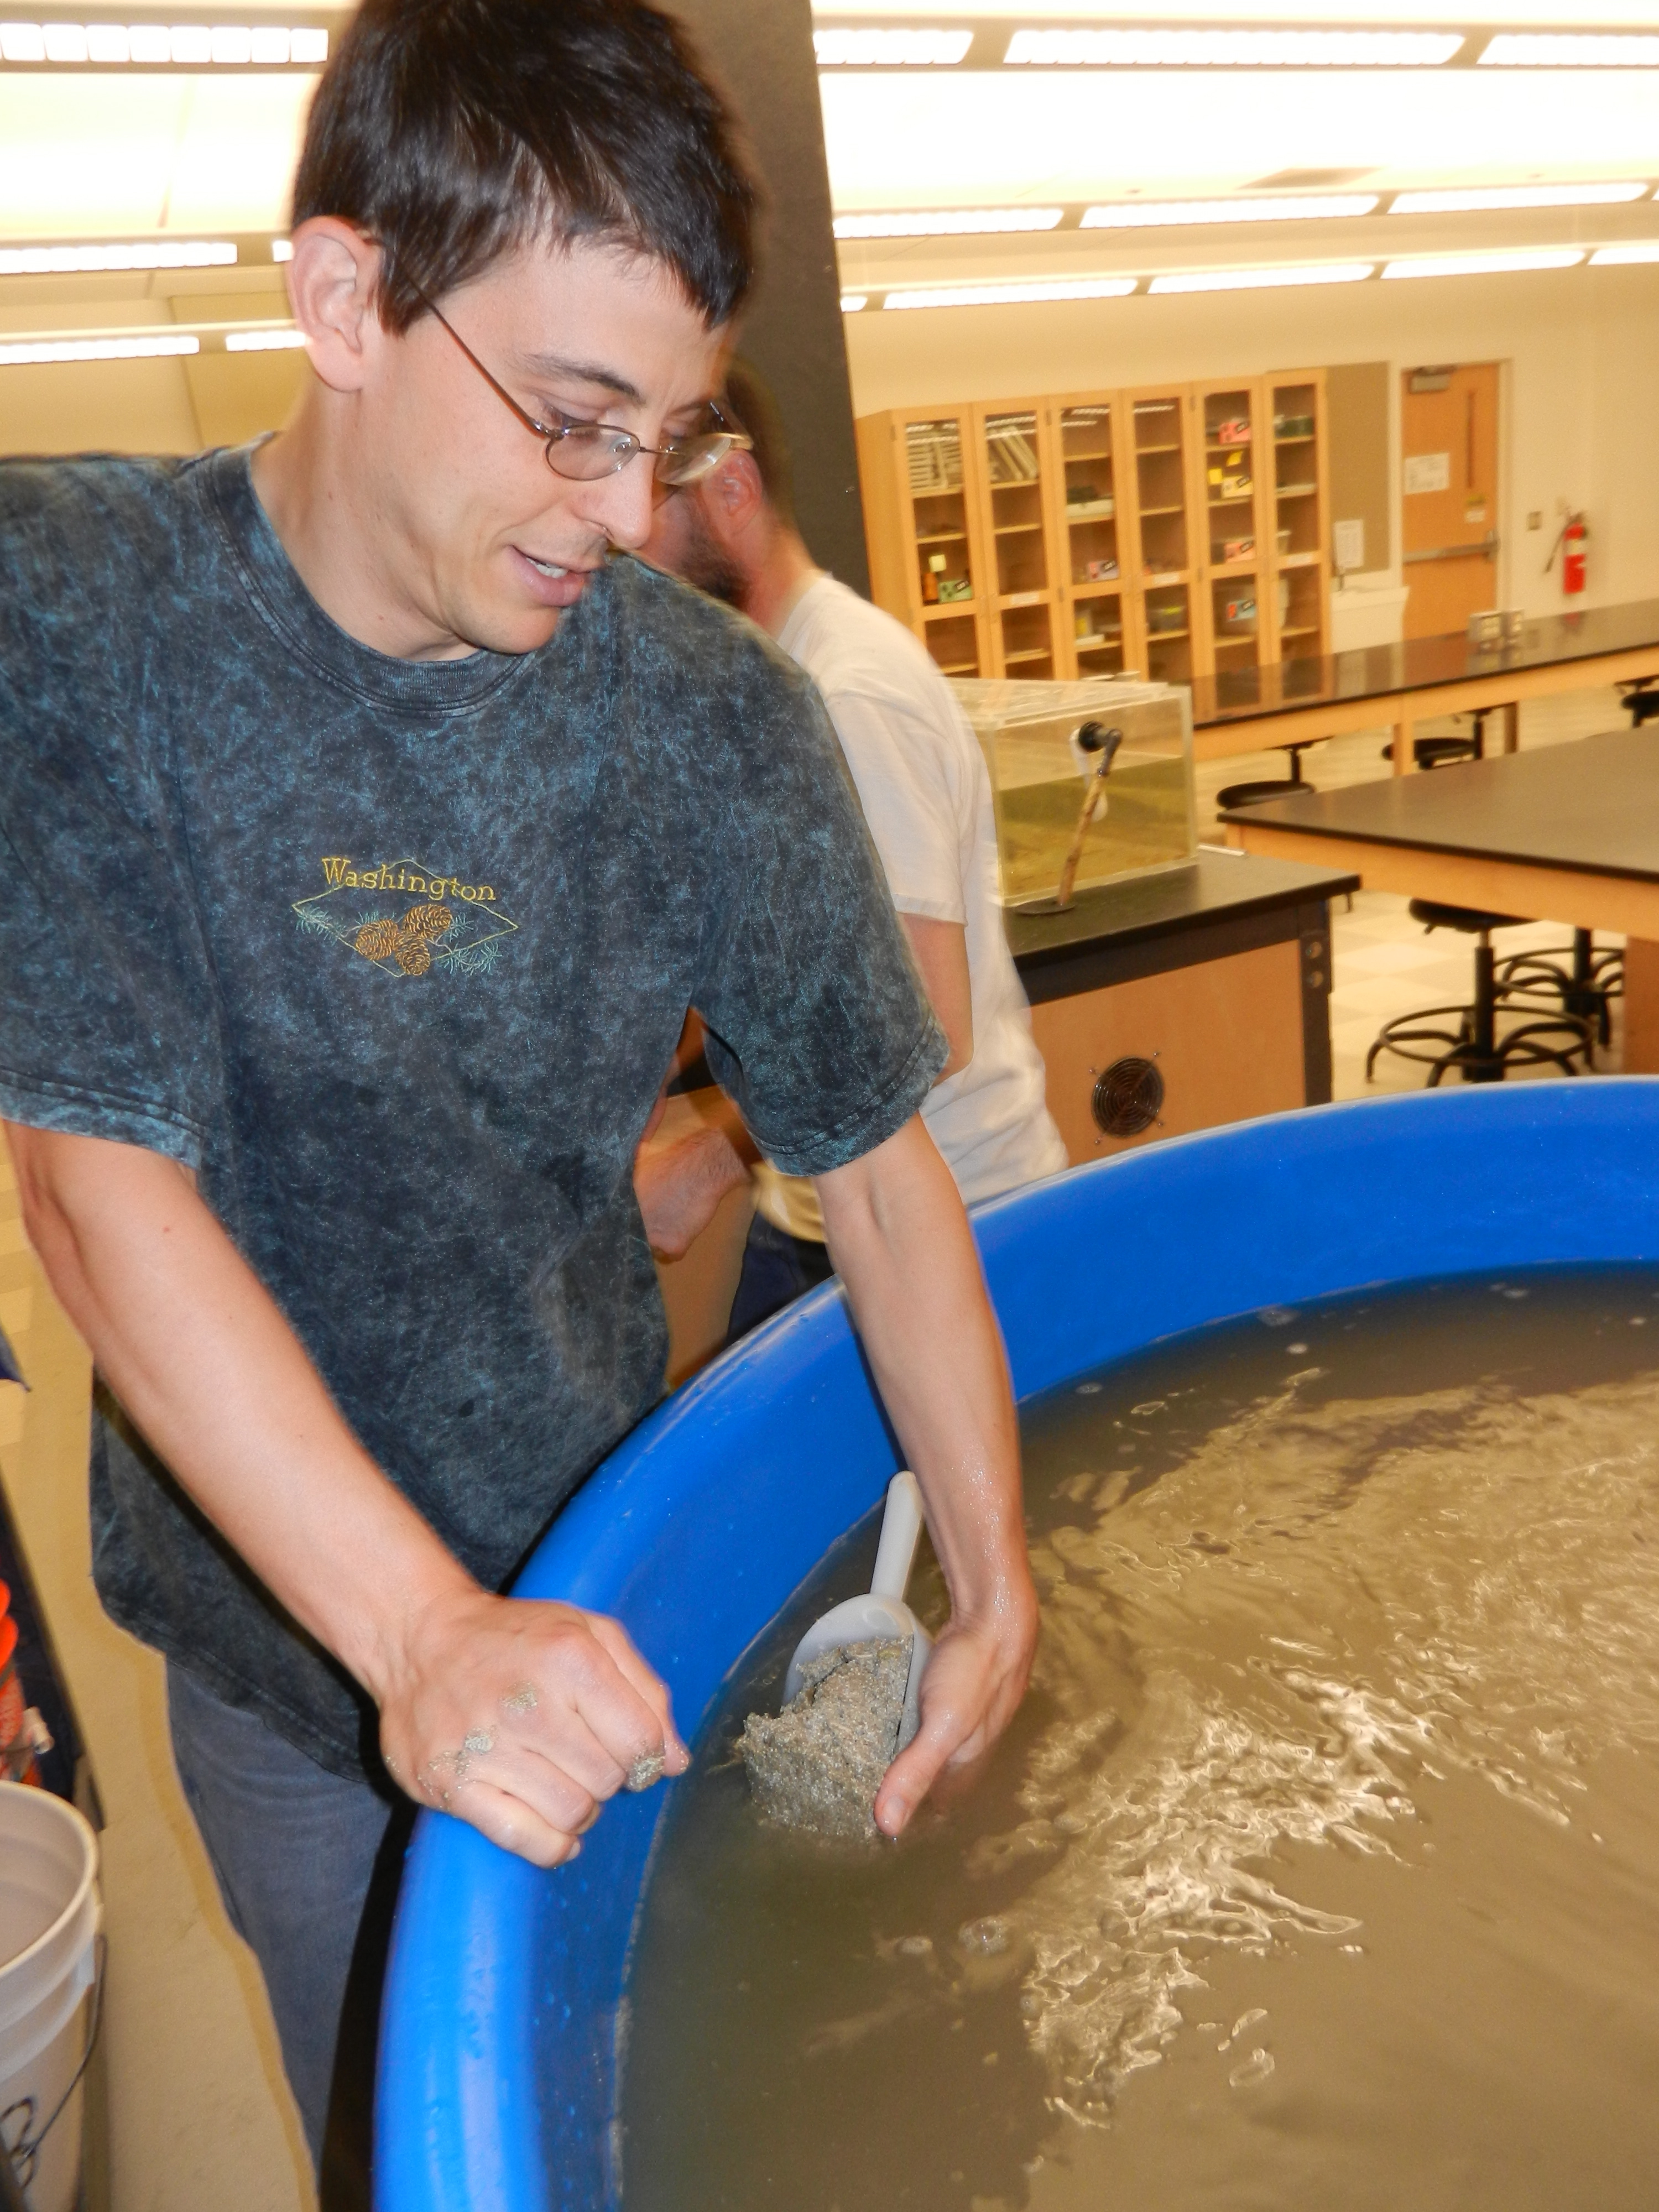
So cool, now all we had to do was prepare nucleosomal DNA and RNA from Haloferax, sequence the samples, build a map and see where it led us. With everyone in the lab otherwise occupied, I tried to grow these critters. At first I was convinced I’d been out of the lab too long as nothing grew. Actually I just needed to be a little patient. Then the first cell pellets were so snotty that I aspirated them into oblivion. Finally, I had plenty of pellets and my talented yeast nucleosome group adapted their protocols such that we got nice nucleosome ladders.


 This was a pleasant surprise and one we did not take for granted given the high CG content of the genome (65%). We then turned to isolating RNA. Without polyA tails for enrichment, our first attempts at RNA-seq were 95% ribosomal. Combining partially successful double-stranded nuclease (DSN) treatment with massive sequencing depth we were able to get fairly high coverage of the transcriptome. Here’s where Ron Ammar, a graduate student supervised by me, Guri Giaever and Gary Bader stepped in and turned my laboratory adventures into a wonderful story. Ron mapped the reads from our nucleosome samples to the reference genome and found what to my eyes looked like a yeast nucleosome map only at half scale.

Here were well-ordered arrays in the gene bodies and nucleosome depleted regions at the ends of genes. The Haloferax genome is a model of streamlining and as a consequence, intergenic regions are tiny and hard to define. With little published data to guide the definition of archea promoters and terminators the transcriptome map saved us. Ron focused on the primary chromosome in Haloferax and hand curated each transcription start and stop site based on the RNA-seq data. This is when we realized we had something interesting. Here were nucleosome depleted promoters and nucleosome depleted terminators and when we constructed an average-o-gram of all the nucleosome signatures for each promoter on the main chromosome, it looked like this….


The take home
The data strongly suggested that archae chromatin is organized in a matter very similar to eukaryotes. And further, the correlation between gene expression and nucleosome positioning, particularly with respect to the +1 and -1 nucleosomes was conserved. This conservation begs some interesting speculation. According to Koonin and colleagues the common ancestor of eukaryotes and archea predates the evolutionary split that gave rise to euryarchael and crenarchael lineages. Both of these branches have bona fide nucleosomes, therefore it would seem parsimonious to assume that the ancestor of these two branches also organized its genome into chromatin with anucleosomal scaffold. The similarities between the chomatin in archaea and eukaryotes, and the correlation between nucleosome occupancy and gene expression in archaea raise the interesting evolutionary possibility that the initial function of nucleosomes and chromatin formation might have been to regulate gene expression rather than for packaging of DNA. This is consistent with two decades of research that has shown that there is an extraordinarily complex relationship between the structure of chromatin and the process of gene expression. It also jives with in vitro observations that yeast H3/H4 tetramers can support robust transcription, while H2A/H2B tetramers cannot.
It is possible, therefore, that as the first eukaryotes evolved, nucleosomes and chromatin started to further compact their DNA into nuclei, which among other things, helped to prevent DNA damage, and that this subsequently enabled early eukaryotes to flourish. This observation is so exciting to me because it brings up so many questions that we can actually address such as- if there are nucleosomes comprised of histones, where are the histone chaperones? And further- despite the conventional wisdom that archael nucleosomes are not post translationally modified- this remains to be confirmed (or denied) experimentally. If conventional wisdom is correct and archea histones are not post countries post-translational and modified, then when did this innovation arise? There are more than enough questions to keep the lab buzzing!
Publishing the paper
Because I truly believed that this result “would be of general interest to a broad readership” we prepared a report for Science which was returned to us within 48 hours. The turnaround from Nature was even faster. I had received emails from eLIFE several months previously, and after reading the promotional materials and the surrounding press, we took our chances s at eLIFE and hoped for the best. The best is exactly what we got. Within a few days the editors emailed that the manuscript was out for peer review and four weeks later we received the reviews. They were unique. They outlined required, non-negotiable revisions (including a complete resequencing of the genome after MNase digestion but without prior cross-linking) but contained no gray areas and required no mind-reading. With all hands on deck and we resubmitted the manuscript in four weeks and were overjoyed with its acceptance. Of course with N=1, combined with a positive outcome it’s hard to be anything but extremely positive about this new journal. But I think the optimism is defendable- the reviews were transparent, and the criticisms made it a better paper. The editorial staff was supportive gave us the opportunity to take the first stab at drafting the digest which accompanies the manuscript.
NOTE ADDED BY JONATHAN EISEN. A preprint of the paper is available here. Thanks to the eLife staff for helping us out with this and encouraging posting prior to formally going live on the eLife site.
What’s next and what’s in the freezer
This work represents the Haloferax reference condition, with asynchronously growing cells in rich, high-salt media. We recently collected samples of log phase cultures exposed to several environmental stresses and samples from lag, log and stationary phases of growth to chart archael nucleosome dynamics. We are also refining a home-made ribosomal depletion protocol to make constructing complementary transcriptome maps considerably cheaper. Finally, it is exciting to contemplate a consortium effort to create a systematic, barcoded set of Haloferax deletion (or disruption) mutants for systematic functional studies.
Mille grazie to Jonathan E. for inspiring me to looking at understudied microbes and for encouraging me to walk the walk with respect to publishing in open access forums. And for letting me share my thoughts as a guest on his blog
 |
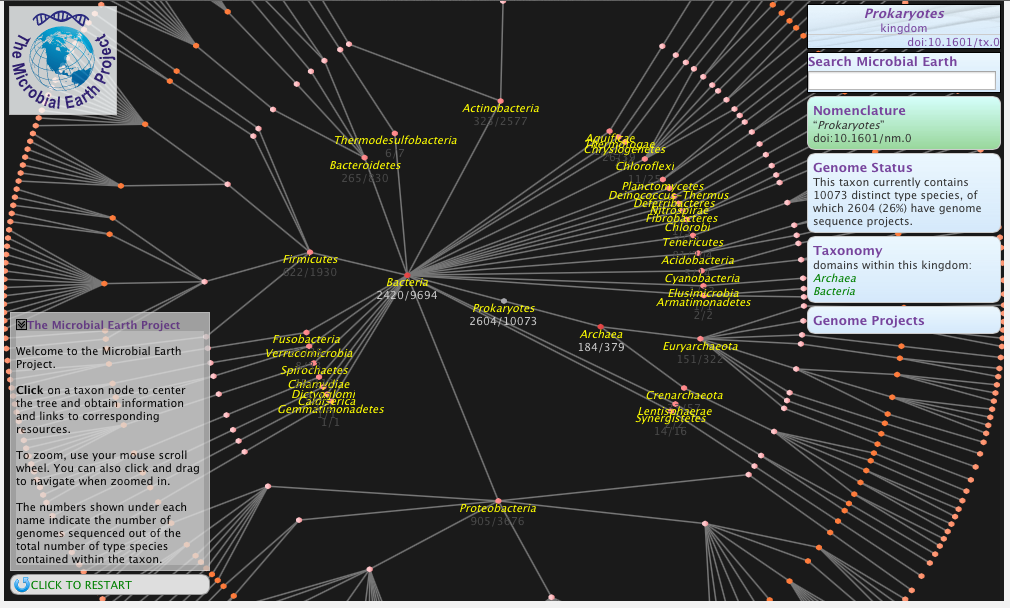
| The tree of life from Haloferax’s perspective Artwork by Trine Giaever
|


 This was a pleasant surprise and one we did not take for granted given the high CG content of the genome (65%). We then turned to isolating RNA. Without polyA tails for enrichment, our first attempts at RNA-seq were 95% ribosomal. Combining partially successful double-stranded nuclease (DSN) treatment with massive sequencing depth we were able to get fairly high coverage of the transcriptome. Here’s where Ron Ammar, a graduate student supervised by me, Guri Giaever and Gary Bader stepped in and turned my laboratory adventures into a wonderful story. Ron mapped the reads from our nucleosome samples to the reference genome and found what to my eyes looked like a yeast nucleosome map only at half scale.