Eisen Lab Blog

Nice Collection from Diane Dawson: Open Science and Crowd Science: Selected Sites and Resources

Quick post here – already posted to Twitter and wanted to make sure this one was seen by people who read this blog but don’t follow me on Twitter.

There is a nice compilation/commentary/review from Diane Dawson titled Open Science and Crowd Science: Selected Sites and Resources.  It is in the journal “Issues in Science and Technology Librarianship” (which I note – is a new one to me).  It has a lot of useful resources and comments about various open science activities on the web.  Definitely worth checking out.

Yum – Carbon monoxide, worms, bacteria – all together – what could be better

Just a quick one here pointing people to a paper and some stories relating to work by Nicole Dubilier on the worm Olavius algarvensis and it’s chemosynthetic symbionts.

Guest post: Story Behind the Paper by Joshua Weitz on Neutral Theory of Genome Evolution

I am very pleased to have another in my “Story behind the paper” series of guest posts.  This one is from my friend and colleague Josh Weitz from Georgia Tech regarding a recent paper of his in BMC Genomics.  As I have said before – if you have published an open access paper on a topic related to this blog and want to do a similar type of guest post let me know …

—————————————-
A guest blog by Joshua Weitz, School of Biology and Physics, Georgia Institute of Technology

Summary This is a short, well sort-of-short, story of the making of our paper: “A neutral theory of genome evolution and the frequency distribution of genes” recently published in BMC Genomics. I like the story-behind-the-paper concept because it helps to shed light on what really happens as papers move from ideas to completion. It’s something we talk about in group meetings but it’s nice to contribute an entry in this type of forum.  I am also reminded in writing this blog entry just how long science can take, even when, at least in this case, it was relatively fast. 


The pre-history The story behind this paper began when my former PhD student, Andrey Kislyuk (who is now a Software Engineer at DNAnexus) approached me in October 2009 with a paper by Herve Tettelin and colleagues.  He had read the paper in a class organized by Nicholas Bergman (now at NBACC). The Tettelin paper is a classic, and deservedly so.  It unified discussions of gene variation between genomes of highly similar isolates by estimating the total size of the pan and core genome within multiple sequenced isolates of the pathogen Streptococcus agalactiae.  

However, there was one issue that we felt could be improved: how does one extrapolate the number of genes in a population (the pan genome) and the number of genes that are found in all individuals in the population (the core genome) based on sample data alone?  Species definitions notwithstanding, Andrey felt that estimates depended on details of the alignment process utilized to define when two genes were grouped together.  Hence, he wanted to evaluate the sensitivity of core and pan geonme predictions to changes in alignment rules.  However, it became clear that something deeper was at stake.  We teamed up with Bart Haegeman, who was on an extended visit in my group from his INRIA group in Montpellier, to evaluate whether it was even possible to quantitatively predict pan and core genome sizes. We concluded that pan and core genome size estimates were far more problematic than had been acknowledged.  In fact, we concluded that they depended sensitively on estimating the number of rare genes and rare genomes, respectively.  The basic idea can be encapsulated in this figure:

The top panels show gene frequency distributions for two synthetically generated species.  Species A has a substantially smaller pan genome and a substantially larger core genome than does Species B.  However, when one synthetically generates a sample set of dozens, even hundreds of genomes, then the rare genes and genomes that correspond to differences in pan and core genome size, do not end up changing the sample rarefaction curves (seen at the bottom, where the green and blue symbols overlap).  Hence, extrapolation to the community size will not necessarily be able to accurately estimate the size of the pan and core genome, nor even which is larger!

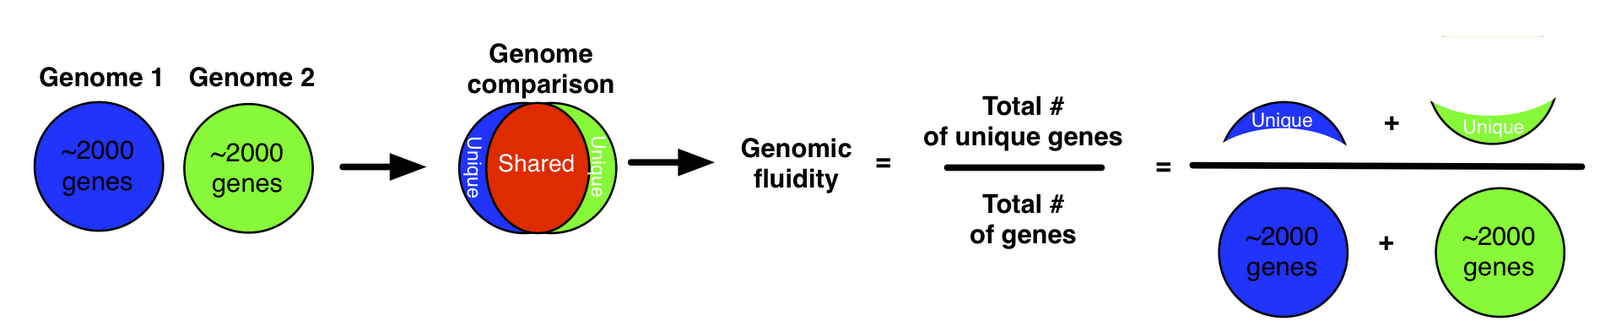
As an alternative, we proposed a metric we termed “genomic fluidity” which captures the dissimilarity of genomes when comparing their gene composition.

The quantitative value of genomic fluidity of the population can be estimated robustly from the sample.  Moreover, even if the quantitative value depends on gene alignment parameters, its relative order is robust.  All of this work is described in our paper in BMC Genomics from 2011: Genomic fluidity: an integrative view of gene diversity within microbial populations.

However, as we were midway through our genomic fluidity paper, it occurred to us that there was one key element of this story that merited further investigation.  We had termed our metric “genomic fluidity” because it provided information on the degree to which genomes were “fluid“, i.e., comprised of different sets of genes.  The notion of fluidity also implies a dynamic, i.e., a mechanism by which genes move. Hence, I came up with a very minimal proposal for a model that could explain differences in genomic fluidity.  As it turns out, it can explain a lot more.

A null model: getting the basic concepts together
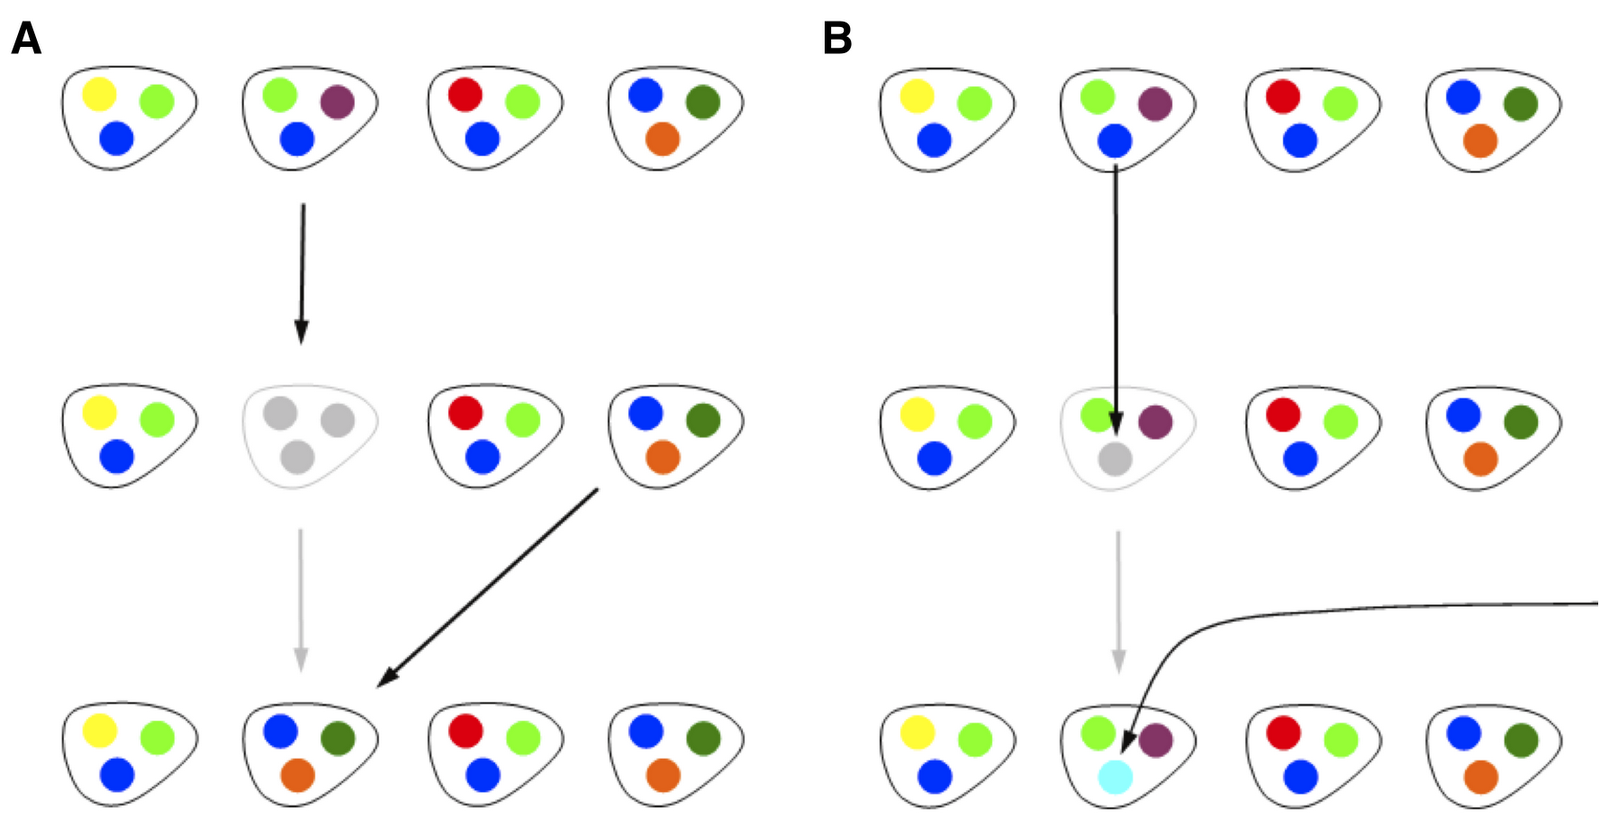
In Spring 2010, I began to explore a minimal, population-genetics style model which incorporated a key feature of genomic assays, that the gene composition of genomes differs substantially, even between taxonomically similar isolates. Hence, I thought it would be worthwhile to  analyze a model in which the total number of individuals in the population was fixed at N, and each individual had exactly M genes.  Bart and I started analyzing this together. My initial proposal was a very simple model that included three components: reproduction, mutation and gene transfer. In a reproduction step, a random individual would be selected, removed and then replaced with one of the remaining N-1 individuals.  Hence, this is exactly analogous to a Moran step in a standard neutral model.  At the time, what we termed mutation was actually representative of an uptake event, in which a random genome was selected, one of its genes was removed, and then replaced with a new gene, not found in any other of the genomes.  Finally, we considered a gene transfer step in which two genomes would be selected at random, and one gene from a given genome would be copied over to the second genome, removing one of the previous genes.  The model, with only birth-death (on left) and mutation (on right), which is what we eventually focused on for this first paper, can be depicted as follows:

We proceeded based on our physics and theoretical ecology backgrounds, by writing down master equations for genomic fluidity as a function of all three events. It is apparent that reproduction decreases genomic fluidity on average, because after a reproduction event, two genomes have exactly the same set of genes.  Likewise, gene transfer (in the original formulation) also decreases genomic fluidity on average, but the decrease is smaller by a factor of 1/M, because only one gene is transferred.  Finally, mutation increases genomic fluidity on average, because a mutation event occurring at a gene which had before occurred in more than one genome, introduces a new singleton gene in the population, hence increasing dissimilarity. The model was simple, based on physical principles, was analytically tractable, at least for average quantities like genomic fluidity, and moreover it had the right tension.  It considered a mechanism for fluidity to increase and two mechanisms for fluidity to decrease.  Hence, we thought this might provide a basis for thinking about how relative rates of birth-death, transfer and uptake might be identified from fluidity.  As it turns out, many combinations of such parameters lead to the same value of fluidity.  This is common in models, and is often referred to as an identifiability problem. However, the model could predict other things, which made it much more interesting.   


The making of the paper
The key moment when the basic model, described above, began to take shape as a paper occurred when we began to think about all the data that we were not including in our initial genomic fluidity analysis.  Most prominently, we were not considering the frequency at which genes occurred amongst different genomes.  In fact, gene frequency distributions had already attracted attention.  A gene frequency distribution summarizes the number of genes that appear in exactly k genomes. The frequency with which a gene appears is generally thought to imply something about its function, e.g., “Comprising the pan-genome are the core complement of genes common to all members of a species and a dispensable or accessory genome that is present in at leastbone but not all members of a species.” (Laing et al., BMC Bioinformatics 2011).  The emphasis is mine. But does one need to invoke selection, either implicitly or explicitly, to explain differences in gene frequency? 

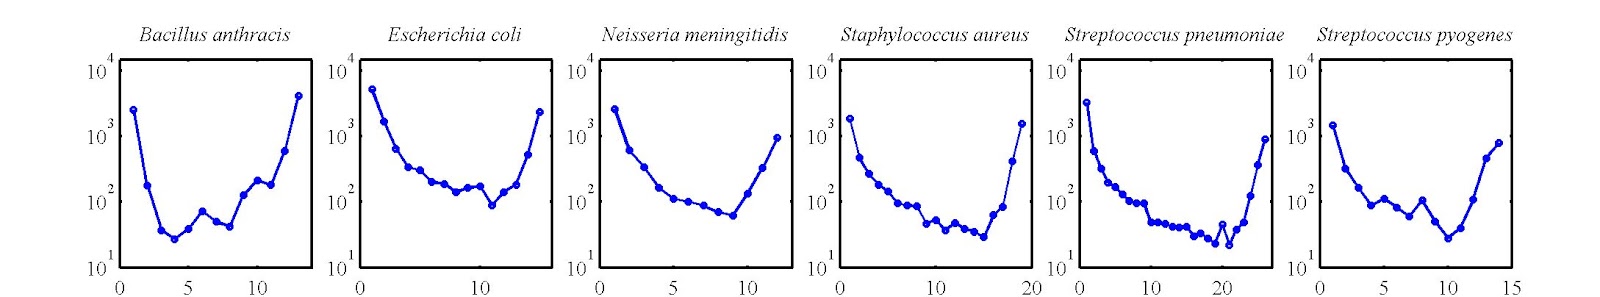
As it turns out, gene frequency distributions end up having a U-shape, such that many genes appear in 1 or a few genomes, many in all genomes (or nearly all), and relatively few occur at intermediate levels.  We had extracted such gene frequency distributions from our limited dataset of ~100 genomes over 6 species.  Here is what they look like:

And, when we began to think more about our model, we realized that the tension that led to different values of genomic fluidity also generated the right sort of tension corresponding to U-shaped gene frequency distributions.  On the one-hand, mutations (e.g., uptake of new genes from the environment) would contribute to shifting the distribution to the left-hand-side of the U-shape.  On the other hand, birth-death would contribute to shifting the distribution to the right-hand side of the U-shape.  Gene transfer between genomes would also shift the distribution to the right. Hence, it seemed that for a given set of rates, it might be possible to generate reasonable fits to empirical data that would generate a U-shape. In doing so, that would mean that the U-shape was not nearly as informative as had been thought.  In fact, the U-shape could be anticipated from a neutral model in which one need not invoke selection. This is an important point as it came back to haunt us in our first round of review.

So, let me be clear: I do think that genes matter to the fitness of an organism and that if you delete/replace certain genes you will find this can have mild to severe to lethal costs (and occasional benefits).  However, our point in developing this model was to try and create a baseline null model, in the spirit of neutral theories of population genetics, that would be able to reproduce as much of the data with as few parameters as possible.  Doing so would then help identify what features of gene compositional variation could be used as a means to identify the signatures of adaptation and selection.  Perhaps this point does not even need to be stated, but obviously not everyone sees it the same way.  In fact, Eugene Koonin has made a similar argument in his nice paper, Are there laws of adaptive evolution: “the null hypothesis is that any observed pattern is first assumed to be the result of non-selective, stochastic processes, and only once this assumption is falsified, should one start to explore adaptive scenarios”.  I really like this quote, even if I don’t always follow this rule (perhaps I should). It’s just so tempting to explore adaptive scenarios first, but it doesn’t make it right.

At that point, we began extending the model in a few directions.  The major innovation was to formally map our model onto the infinitely many alleles model of population genetics, so that we could formally solve our model using the methods of coalescent theory for both cases of finite population sizes and for exponentially growing population sizes.  Bart led the charge on the analytics and here’s an example of the fits from the exponentially growing model (the x-axis is the number of genomes):

At that point, we had a model, solutions, fits to data, and a message.  We solicited a number of pre-reviews from colleagues who helped us improve the presentation (thank you for your help!).  So, we tried to publish it.    


Trying to publish the paper
We tried to publish this paper in two outlets before finding its home in BMC Genomics.  First, we submitted the article to PNAS using their new PNAS Plus format.  We submitted the paper in June 2011 and were rejected with an invitation to resubmit in July 2011. One reviewer liked the paper, apparently a lot: “I very much like the assumption of neutrality, and I think this provocative idea deserves publication.”  The same reviewer gave a number of useful and critical suggestions for improving the manuscript.  Another reviewer had a very strong negative reaction to the paper. Here was the central concern: “I feel that the authors’ conclusion that the processes shaping gene content in bacteria and primarily neutral are significantly false, and potentially confusing to readers who do not appreciate the lack of a good fit between predictions and data, and who do not realise that the U-shaped distributions observed would be expected  under models where it is selection that determines gene number.”  There was no disagreement over the method or the analysis.  The disagreement was one of what our message was.

I still am not sure how this confusion arose, because throughout our first submission and our final published version, we were clear that the point of the manuscript was to show that the U-shape of gene frequency distributions provide less information than might have been thought/expected about selection.  They are relatively easy to fit with a suite of null models.  Again, Koonin’s quote is very apt here, but at some basic level, we had an impasse over a philosophy of the type of science we were doing. Moreover, although it is clear that non-neutral processes are important, I would argue that it is also incorrect to presume that all genes are non-neutral.  There’s lots of evidence that many transferred genes have little to no effect on fitness. We revised the paper, including and solving alternative models with fixed and flexible core genomes, again showing that U-shapes are rather generic in this class of models.  We argued our point, but the editor sided with the negative review, rejecting our paper in November after resubmission in September, with the same split amongst the reviewers. 

Hence, we resubmitted the paper to Genome Biology, which rejected it at the editorial level after a few week delay without much of an explanation, and at that point, we decided to return to BMC Genomics, which we felt had been a good home for our first paper in this area and would likely make a good home for the follow-up.  A colleague once said that there should be an r-index, where r is the number of rejections a paper received before ultimate acceptance.  He argued that r-indices of 0 were likely not good (something about if you don’t fall, then you’re not trying) and an r-index of 10 was probably not good either.  I wonder what’s right or wrong. But I’ll take an r of 2 in this case, especially because I felt that the PNAS review process really helped to make the paper better even if it was ultimately rejected. And, by submitting to Genome Biology, we were able to move quickly to another journal in the same BMC consortia.

Upcoming plans
Bart Haegeman and I continue to work on this problem, from both the theory and bioinformatics side.  I find this problem incredibly fulfilling.  It turns out that there are many features of the model that we still have not fully investigated.  In addition, calculating gene frequency distributions involves a number of algorithmic challenges to scale-up to large datasets.  We are building a platform to help, to some extent, but are looking for collaborators who have specific algorithmic interests in these types of problems.  We are also in discussions with biologists who want to utilize these types of analysis to solve particular problems, e.g., how can the analysis of gene frequency distributions be made more informative with respect to understanding the role of genes in evolution and the importance of genes to fitness.  I realize there are more of such models out there tackling other problems in quantitative population genomics (we cite many of them in our BMC Genomics paper), including some in the same area of understanding the core/pan genome and gene frequency distributions. I look forward to learning from and contributing to these studies.

Nathan Wolfe talk at #UCDavis Wrap Up #Storify #Viruses

Nathan Wolfe talked at UC Davis yesterday.  I met with him for 30 minutes just before his talk.  Many times I feel that 30 minutes is more than enough when meeting with outside seminar speakers.  I definitely would have enjoyed more time with Wolfe – he does some pretty fascinating stuff.

Anyway – I escorted him to his talk and then I took notes for it on Twitter as did Pam Ronald (who was sitting next to me).  I then made a “Storification” of the talk (using the Storify.Com system).

This is below:

http://storify.com/phylogenomics/nathan-wolfe-talk-at-ucdavis.js[<a href=”http://storify.com/phylogenomics/nathan-wolfe-talk-at-ucdavis” target=”_blank”>View the story “Nathan Wolfe talk at #UCDavis” on Storify</a>]

Wow – ALVIN submarine has potential to be vector for species movement cc: @deepseanews

Well, it is (relatively) common knowledge that surface ships can serve as unintentional vectors for the movement of organisms via things like ballast water (see for example this recent post on Deep Sea News which discusses this in part).  And the ecological favor wreaked by such ship-based-transport can be immense.

A new paper, and news story, call attention to an analogous process that might occur with deep-sea submarines (see news story here: U.S. News – Deep-sea aliens hitched ride by submarine to pristine area).  The basic summary is – researchers using the deep sea sub ALVIN have discovered that, contrary to expectations, some organisms from the deep were able to survive the sub surfacing, being brought on board the mother ship, and then being sent back down to another site.  Some limpets apparently hung out in some tubing for a day and were then “sampled” by the sub at another site.  Apparently, nobody had thought this might be an issue because they had assumed that the surfacing and bringing on deck and cleaning of ALVIN would kill any organisms from one site before traversing to the next place.  Apparently not.

I note one comment – it seems reasonable to think that microbes might be hitching a ride on ALVIN and other submersibles too … which brings me back to the recent post on Deep Sea News I linked to above.  It is by Holly Bik, a post doc in my lab, and in it she discussed the possibility that microbes might be getting moved around by surface ships.  Well, it seems that submersibles should be looked at too ..

Skeptical of this: Invitation to Participate in the East African Universities’ Lecture Series and a Safari

Hmm … this smells off. Must be as SCAM somewhere in here.
Updated 12/13/13. I do not think this is a SCAM.  But I am not quite sure what it is.

———- Forwarded message ———-
From: Tours of Purpose (TOP) <info@toursofpurpose.com>
Date: Wed, May 23, 2012 at 9:29 PM
Subject: Invitation to Participate in the East African Universities’
Lecture Series and a Safari

Dear University of California Faculty and Staff:

Tours of Purpose, TOP, a professor exchange agency dedicated to the
development and improvement of economic, academic and general welfare
in East Africa (i.e., Uganda, Kenya, Tanzania, Rwanda and Burundi) is
hereby extending a humble invitation to you to participate in our
ongoing program of lecture series taking place in our local
universities, colleges, high schools, primary schools and other
academic institutions.  Additionally, TOP would like to avail to you a
one in a lifetime opportunity to take a safari where you will see and
photograph lions, elephants, giraffes, leopards, zebras, hippos,
rhinos, among an array of wildlife, in addition to a rare opportunity
to visit the mountain gorillas and man’s closest relative, the chimp,
at a TOP’ scholars’ give away price. Winston Churchill took this trip
and immortally dabbed Uganda “The Pearl of Africa”, and Queen
Elizabeth was on such a safari when she learned that she had become
queen of England. The average visit lasts for about two weeks–with a
couple of days or so dedicated to visiting the said incredible African
wildlife reserves–although you may wish for your particular visit to
be shorter or longer. TOP would like to partner with a specific
professor, or any academician, in pursuing a possibility of coming to
East Africa to deliver lectures in any given dispositive academic
discipline.  TOP will cooperate with you in arranging and customizing
your travel details to Africa, including picking you up at the airport
in TOP state of the art SUVs, booking fair accommodation, arranging
your meals, setting and managing your speaking schedule, taking you on
a safari trip and other tours, and ultimately delivering you to the
airport for your flight home. TOP invariably offers the option of one
being paired with another educator from North America or Europe during
this trip, although traveling alone in East Africa is not complicated
nor precarious at all.

Thus, if TOP secures your willingness to participate, TOP will, first,
discuss with you the financial side of it, including revealing what
assistance may be available for you in this regard so that you can
achieve your $1,200 or so round trip air ticket.  Second, where a
Holiday Inn-style room costs about $180 a night in East Africa, TOP
offers you even better accommodation in our partnering hotel, Giraffe
Park Hotel, at $350 a week, breakfast and dinner inclusive. Lunch can
be packed or arranged very reasonably.  As a TOP scholar, you also
qualify for $200 towards your travel expenses.

Consider, too, should you have plans of traveling to or through
Europe, why not shoot two birds with one stone by detouring through
East Africa for the instant, noble purpose and halve the costs, not to
mention the time to be saved or to be well used. Take note, too, that
in addition to some of your students who may either just want to
accompany you or do an internship here, you can invite your family and
friends as well.

As such, your willingness to participate dwarfs all financial
concerns, for TOP stands with you to make this trip not only
economical but, most importantly, simple to handle all around. In
fact, as an American educator, you are due to discover that your worth
to the vast world’s academic needs is patently inestimable and that
sharing your expertise inures a hidden fulfillment.

In sum, this email cannot answer all the questions you might have
regarding this trip, therefore, you are encourage to contact me so
that we can further this conversation, including chatting on the
phone, if you desire.  Needless to say, I, or a TOP representative,
will be available to talk with you about either an immediate trip or
to muse about a distant future possibility for this lectureship, in
addition to whether TOP, in conjunction with our local institutions,
should promulgate a concrete, personalized proposal for your
consideration.

Lastly, feel very welcome to visit our website (http://www.toursofpurpose.com
) to learn more about us and to view photos and read up on
testimonials of past participants. Also, on the website you will be
able to either join us on Facebook or to follow us on twitter.

Therefore, we hope to hear from you soon.

Sincerely,

~Josephine Nakandi
Program Director


~~~~~~~~~~~~~~~~~~~~~~~~
Tours of Purpose, TOP
49 Nakawa Road, Suite 400
Kampala, Uganda, East Africa
Tel: +256 778 899 429
info@toursofpurpose.com
http://www.toursofpurpose.com
~~~~~~~~~~~~~~~~~~~~~~~~


UPDATE 12/12/13

Some miscellaneous stuff I found on the web relating to Tours of Purpose

Denis White, a Professor at U. Toledo has some doubts about financial behavior of “Teach and Tours Sojourner” which he reports has the same contact # as Tours of Purpose.
Teach and Tours Sojourners and Tours of Purpose both work with Stawa University

A reviewer of Teach and Tour Sojourners on Trip Advisor has some serious negative comments.

The “Meta Name” tag in the source of the current Tours of Purpose website reads:

” “

The “Title” tag in the current website reads “Tours of Purpose | Teach and Tour Sojourners, Kampala, Uganda, Entebbe”

Another negative review of TATS is here.

I note – there are also positive reviews out there of TATS and TOP.   Hard to know just what is going on here.  Could be that someone is trying hard and occasionally things go poorly.  I have no idea.

Kimberly-Clark’s deceptive self serving PR regarding germs in the workplace #BadReportingToo

First I saw of this story was here: Study: Bacteria fills office break rooms – Local News – Houston, TX – msnbc.com

Something sounded off with this.  I think it was the fact that it involved “Cleaning products company Kimberly-Clark” that raised some alarm bells.  The involvement of Charles Gerba also left me a bit queasy as I have seen his name associated with a few recent “studies” which are basically germaphobia funded by cleaning product companies.

After looking around a bit I got discouraged at the whole thing and put it out of my head for a few hours.  And then David Coil, a post doc in my lab, sent me a link to the press release behind this story.  And boy is it a doozy.

The PR basically makes the following dubious statements or implications
* All bacteria are bad.  The whole PR references a study that they imply is about detecting bacteria in various locations.  And when they detect high levels they conclude this is bad.  For example in the title “Where the Germs Are: New Study Finds Office Kitchens and Break Rooms are Crawling with Bacteria“.  Or in the text: “If you thought the restroom was the epicenter of workplace germs you don’t want to know about office break rooms and kitchens” “office germ “hot-spots,”” “Office workers are potentially being exposed to illness-causing bacteria right in their own lunchrooms” and much more.  Uggh.  Not all bacteria are bad.  Gerba and Kimberly-Clark must know this yet they purposefully mislead.

* Presence of ATP means presence of bacteria (and see above – this must imply presence of bad bacteria).  Wow.  Not sure what to say here.  But they use a test for ATP which they say  “ATP is present in all animal, vegetable, bacteria, yeast and mold cells. Detection of ATP indicates the presence of contamination by any of these sources. Everyday objects with an ATP reading of 300 or higher are considered to have a high risk for illness transmission.”  No citation given. And sounds highly dubious to go from ATP – > risk for illness.  Sounds completely dubious actually.

* That it is OK to make claims in Press Releases without presenting evidence behind the claims.  The PR tries to make this all seem very scientific.  Well, where is the paper behind this?  They claim “The findings are from a study carried out by Kimberly-Clark Professional* and is believed to be one of the most detailed and comprehensive studies ever conducted on identifying workplace hotspots where germs can lurk.”  Where is the actual data?  Where are the methods described?  Yuck.

Alas – despite the fact that the Press Release is at best a self serving piece of dubious scientific quality – the press has run with the story sucking up everything Gerba and Kimberly Clark are saying.  Ugg.  Here are some examples, many of which really do a poor job on the science and the conflicts of interest inherent in an unpublished study from a cleaning products company

I am getting sick and tired of crap like this.  Kimberly-Clark may make some useful products.  I don’t really know.  But deceptive press releases like this suggest that their dedication to science is, well, low.  They need to clean up their act.

Fall 2012 Introduction to Evolution (EVE 100) teaching position at #UCDavis

DEPARTMENT OF EVOLUTION AND ECOLOGY

FALL 2012

TEACHING POSITION AVAILABLE

LECTURER

Introduction to Evolution

(EVE 100)

FALL 2012 (September 24-December 14, 2012)

Responsibilities: A 60% position teaching EVE 100 – Introduction to Evolution (4 units). Lecture–3 hours, Discussion–1 hour. The course subject provides a general survey of the origins of biological diversity and evolutionary mechanisms. Estimated enrollment: 200

Requirements: Ph.D. and demonstrated effective teaching in the subject course or equivalent course.

Salary: Commensurate upon qualifications.

Please submit letter of application, including summary of qualifications, CV, two letters of recommendation and any applicable teaching evaluation summaries via the link below link which contains additional information about the position.

https://recruitments.ucdavis.edu/PositionDetails.aspx?PositionID=103&Title=Fall-2012-Lecturer—Introduction-to-Evolution-%28EVE-100%29

OPEN UNTIL FILLED. FOR FULL CONSIDERATION APPLICATION MUST BE RECEIVED BY JUNE 22, 2012.

This position may be covered by a collective bargaining unit.

The University of California is an Equal Opportunity/Affirmative Action Employer with a strong institutional commitment to the development of a climate that supports equality of opportunity and respect for diversity.

05/23/12

What to do – what to do – cool microbial art w/ a #badomics word — must resist purchasing — must resist …

OK – thanks to Dan Smith for pointing me to: Phonome original watercolor painting bacteria by artologica

This was inspired in part by phone sampling I helped Dan and Jack Gilbert do at the AAAS meeting.  And Michelle Banks (i.e., @artologica) has not only made microbial art out of it but has coined a new OME word.  I think she is aiming directly at me here … must resist.  Must resist.

BABS meeting at #UCDavis – “Phylogenomics and Systematics”

(Please respond to psward@ucdavis.edu if you plan to attend)

BAY AREA BIOSYSTEMATISTS (BABS) MEETING

Tuesday evening, 22 May 2012

at UC Davis, 1022 Life Sciences Building

“PHYLOGENOMICS AND SYSTEMATICS”

The genomics era holds great promise (and challenge) to systematics. There is the prospect of generating sequence data that will provide unprecedented resolution of phylogenetic relationships across the Tree of Life, and a much improved understanding of the tempo and mode of evolution. Join us for two talks on phylogenomics, along with plenty of discussion, leavened by pizza and beer.

Featuring presentations by…

HOLLY BIK, Postdoctoral Researcher, Eisen Lab, UC Davis Genome Center

“Phylogeny-based taxonomy assignments from environmental metagenome data” (Note updated title)

and…

BASTIEN BOUSSAU, Postdoctoral Fellow, Huelsenbeck Lab, UC Berkeley

“Methods of phylogenetic inference for genome-scale data sets”

Schedule and venue:
5:30 pm: social gathering with beverages (beer and soft drinks) and informal
pizza dinner: cost ca. $10, to be collected at door, 1022 Life Sciences, UC Davis campus.
7:00 – 9:00 pm: talks, followed by discussion, in same room.

Reservations required for beverages and dinner (but not the talk). Please email reservations to your host, Phil Ward: psward@ucdavis.edu by Sunday, May 20

For a map of UC Davis campus and Life Sciences Building:
http://campusmap.ucdavis.edu/?b=97

Parking is available in the West Entry Parking Structure, immediately west of Life Sciences. If coming from the Bay Area take the Hwy. 113 exit off I-80, and then the first exit off Hwy 113, which is Hutchison Drive. This will bring you directly to the parking garage. Or, as Google Maps would say:
http://maps.google.com/maps?saddr=San+Francisco,+CA&daddr=West+Entry+Parking+Structure,+Davis,+CA&hl=en&sll=38.581572,-121.4944&sspn=0.289854,0.441513&geocode=FVJmQAIdKAe0-CkhAGkAbZqFgDH_rXbwZxNQSg%3BFXgRTAId-x2–CEDK9SCt6OfHw&oq=West+Entry+&t=h&mra=ls&z=9

All are welcome, members or not. If you want to join the Biosystematists, sign up for our mailing list at:
https://calmail.berkeley.edu/manage/list/listinfo/babs-l@lists.berkeley.edu

See you in Davis!

Phil