Story behind the paper: Corey Nislow on Haloferax Chromatin and eLife

This is fun.  Today I am posting this guest post from Corey Nislow in my continuing “Story behind the paper” series.  The history of this post is what is most fun for me.  A few weeks ago I received this email from Corey:

Hi Jonathan, I hope this mail finds you well.
I wanted to alert you to a study from our lab that will be coming out in the inaugural issue of eLIFE.
After reading your PLoS ONE paper on the Haloferax volcanii genome (inspiration #1) I ordered the critter, prepared nucleosomes and RNA and we went mapping. Without a student to burden, I actually had to do some work…
Anyhow, we found that the genome-wide pattern of nucleosome occupancy and its relation to gene expression was remarkably yeast like. Unsure of where to send the story, we rolled the dice with the new open access journal eLIFE (inspiration #2) and the experience was awesome. I’m quite keen to pursue generating a barcoded deletion set for Hfx.
here’s the paper (coming out Dec. 10) if you’re curious.

And a PDF of the paper was attached.

And I wrote back quickly in my typically elegant manner:

completely awesome

But then I thought better of it and wrote again

So – can I con you into writing a guest post for my blog about the story behind this paper?  Or if you are writing a description somewhere else I would love to share it

And he said, well, yes.  And with a little back and forth, he wrote up the post that it below.  Go halophiles.  Go Haloferax.  Go open access.  Go science.


Chromatin is an ancient innovation conserved between Archaea and Eukarya  – The story behind the story
By Corey Nislow

My group first became interested in understanding the global organization of chromatin in early 2005 when Lars Steinmetz (now program leader at the EMBL) led a team effort at the Stanford Genome Center to design a state-of-the-art whole genome tiling microarray for Saccharomyces cerevisiae. These were heady times at Ron Davis’ Genome Technology shop and the array was another triumph of technology and teamwork. The array has over 7 million exceedingly small (5 µm²). The history of how this microarray transformed our understanding of the transcriptome began in 2006. As Lars’ group dug deeper, the extent of antisense transcription and its role in the regulation of expression became clear.

The availability of this array and its potential for asking interesting questions inspired me to convince William Lee, a new graduate student in my group (now at Memorial Sloan-Kettering) to embark on a seemingly simple experiment. The idea was to ask if we could use the classic micrococcal nuclease assay to define nucleosome positioning on a DNA template. But rather than using a short stretch of DNA that could be assessed by radioactive end-labeling and slab gel analysis, we decided the time was right to go “full-genome”. Accordingly, the template was all ~12.5mB of the yeast genome. Will systematically worked out conditions appropriate for hybridization, wrote the software to extract signal off the array (we were flying blind as the array did not come with an instruction manual) and producing an output that was compatible with the genome browsers of the time. Will’s computational background proved critical here (and at several later stages of the project). The result of this experiment was a map of the yeast genome with each of its approximately 70,000 nucleosome’s charted with respect to their occupancy (the length of time that the nucleosomes spend in contact with the DNA) and positioning (the location of a particular nucleosome relative to specific sequence coordinates) in a logarithmically growing population of cells (the paper). Both occupancy and positioning regulate access of most trans-acting factors for all DNA transactions. Working with my new colleague Tim Hughes at the University of Toronto, we began to mine this data focusing first on how the diverse occupancy patterns correlated with aspects of transcription, e.g. the presence of transcription factor binding sites, the level of expression of particular genes, and the like. With this data for the entire genome, we could systematically correlate nucleosome positioning/occupancy with functional elements, sequence logos and structural features. Des Tillo, a graduate student in Tim’s lab and now a research fellow with Eran Segal, was able to build a model that could predict nucleosome occupancy. The correlation (R=0.45) was not great but it was miles better than anything that existed at the time. Tim and Eran’s labs, work with Jason Lieb and Jonathan Widom, refined the model to greater accuracy 2009 model.

Our original study (essentially a control experiment to define the benchmark nucleosome map in yeast) has been widely cited- many of these cites have come from what were two opposing camps, the sequence advocates and the trans-acting proponents. The sequence folks posed that nucleosome position is directed by the underlying sequence information while the trans-acting folks see chromatin remodelers as having the primary role. Having last worked on chromatin in 1995 as a postdoc in Lorraine Pillus’ lab (cloning yeast SET1), it has been a scientific treat to be both a participant and observer in this most recent renaissance of chromatin glory.

The protocol

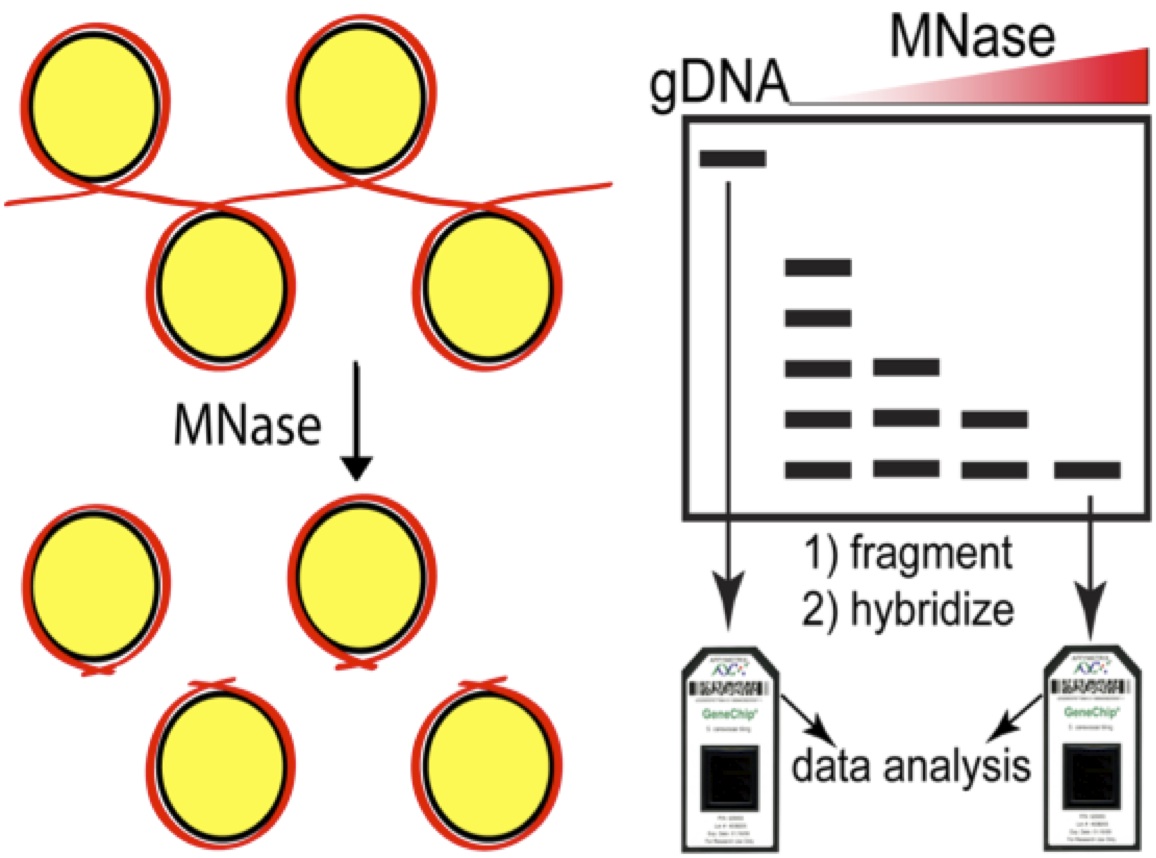
As a reminder, the micrococcal nuclease (MNase) assay relies on the preference of this nuclease to digest linker DNA. By chemically crosslinking histones to DNA with formaldehyde, digesting with MNase, then reversing the crosslinks and deproteinizing the DNA, you obtain 2 populations of DNAs, those protected by digestion (and presumably wrapped around nucleosomes in vivo) and a control sample that is crosslinked but not digested (genomic DNA). The former sample becomes the numerator and the latter the denominator and you take the ration between the two. Initially we compared the microarray signal intensities, now next generation sequence counts are used to define nucleosomal DNA. This cartoon depicts the array based assay, but simply swap in an NGS library step for the arrays to upgrade to the current state-of-the-art.  

In 2007 we were restricted to array-based assays (as were most genomic studies) and frankly, the 4bp resolution of the arrays was pretty amazing. But the introduction of Next-generation sequencing opened up the possibility of charting nucleosomes in worms or wildebeest or almonds, there was nothing to stop you other than the short read lengths at the time. The read length issue has since disappeared as the “short-read” platforms can easily cover the length of a nucleosome protected DNA fragment of ~150bases.

So that brings me to the paper I’d like to highlight today, which asks the question: if (and how) chromatin is organized in the archae, and further, is there any correlation of archae chromatin architecture to gene expression?

My extreme background
Just like the universal fascination of kids with dinosaurs, I was captivated by the discovery of life in extreme environments like boiling water or in acid that could melt flesh on contact. Teaching intro bio, I would try to provoke the students by claiming that discovering extraterrestrial life will be a letdown compared to what we can find on earth. So while my students were occupied with classifying yeast nucleosome and transcriptome profiles in different mutants and drug conditions, I had the rare opportunity to indulge my curiosity. Jonathan E’s talks on the dearth of information on microbes, combined with my re-discovery of the early papers from Reeve and Sandman (see review) had me hooked. Reading the literature was like discovering the existence of a parallel chromatin universe. Archae histone complexes were tetramers (as opposed to the octamers of eukaryotic nucleosome core particles) but most everything else was similar- they wrapped DNA (60-80 bases compared to 147 for yeast) and although archael histones did not share primary sequence similarity to eukaryotic nucleosomes, at the structural level they resembled histone H3 and H4 in eukaryotes.

Working from ignorance
Choosing the particular archaeon to study was dictated by one criterion, the ability to grow it in the lab easily without resorting to anaerobic conditions or similar calisthenics. Again, I was fortunate in that the halophilic arcaeon Haloferax volcanii fit the bill, but more importantly, there was a wealth of literature on this critter, including a well-annoted genome (thanks again Jonathan!) and an impressive armamentarium of genomic tools. Indeed the work of Allers, Mevarech and Lloyd and others have established Hfx. volcanii as a bona fide model organism with excellent transformation gene deletion gene tagging and gene expression tools.


Home for Haloferax volcanii


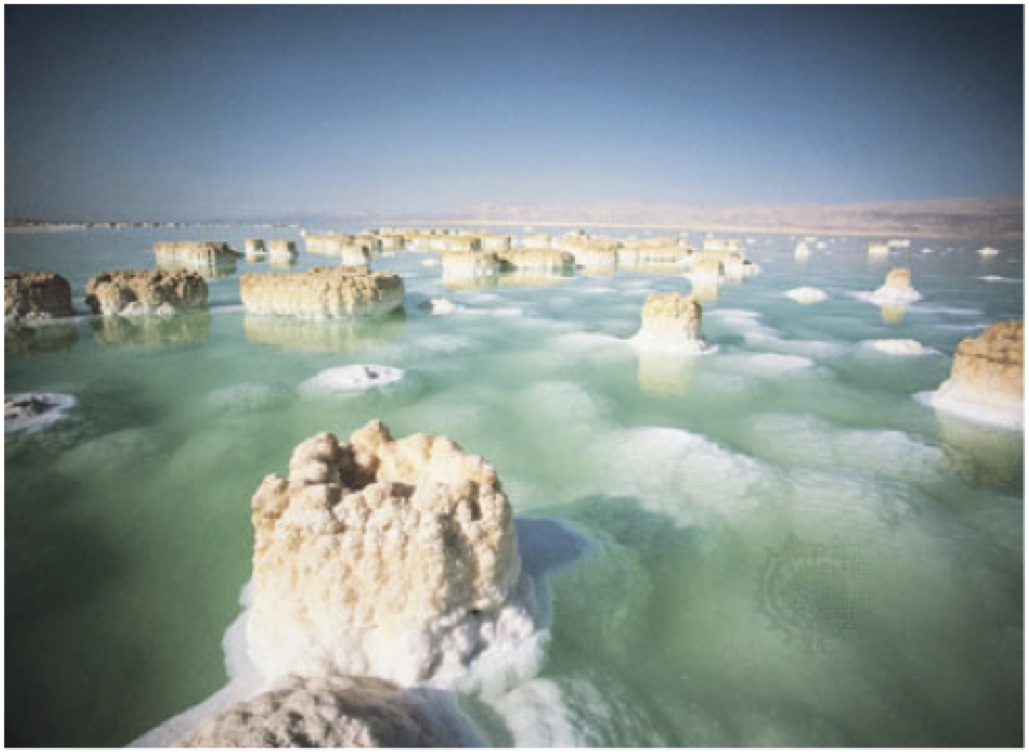
This photograph shows salt pillars that form in the dead sea which borders Jordan to the east and Israel and the West Bank to the west. The salt concentration in the water can exceed 5M!

So cool, now all we had to do was prepare nucleosomal DNA and RNA from Haloferax, sequence the samples, build a map and see where it led us. With everyone in the lab otherwise occupied, I tried to grow these critters. At first I was convinced I’d been out of the lab too long as nothing grew. Actually I just needed to be a little patient. Then the first cell pellets were so snotty that I aspirated them into oblivion. Finally, I had plenty of pellets and my talented yeast nucleosome group adapted their protocols such that we got nice nucleosome ladders.

This was a pleasant surprise and one we did not take for granted given the high CG content of the genome (65%). We then turned to isolating RNA. Without polyA tails for enrichment, our first attempts at RNA-seq were 95% ribosomal. Combining partially successful double-stranded nuclease (DSN) treatment with massive sequencing depth we were able to get fairly high coverage of the transcriptome. Here’s where Ron Ammar, a graduate student supervised by me, Guri Giaever and Gary Bader stepped in and turned my laboratory adventures into a wonderful story. Ron mapped the reads from our nucleosome samples to the reference genome and found what to my eyes looked like a yeast nucleosome map only at half scale.

Here were well-ordered arrays in the gene bodies and nucleosome depleted regions at the ends of genes. The Haloferax genome is a model of streamlining and as a consequence, intergenic regions are tiny and hard to define. With little published data to guide the definition of archea promoters and terminators the transcriptome map saved us. Ron focused on the primary chromosome in Haloferax and hand curated each transcription start and stop site based on the RNA-seq data. This is when we realized we had something interesting. Here were nucleosome depleted promoters and nucleosome depleted terminators and when we constructed an average-o-gram of all the nucleosome signatures for each promoter on the main chromosome, it looked like this….

The take home

The data strongly suggested that archae chromatin is organized in a matter very similar to eukaryotes. And further, the correlation between gene expression and nucleosome positioning, particularly with respect to the +1 and -1 nucleosomes was conserved. This conservation begs some interesting speculation. According to Koonin and colleagues the common ancestor of eukaryotes and archea predates the evolutionary split that gave rise to euryarchael and crenarchael lineages. Both of these branches have bona fide nucleosomes, therefore it would seem parsimonious to assume that the ancestor of these two branches also organized its genome into chromatin with anucleosomal scaffold. The similarities between the chomatin in archaea and eukaryotes, and the correlation between nucleosome occupancy and gene expression in archaea raise the interesting evolutionary possibility that the initial function of nucleosomes and chromatin formation might have been to regulate gene expression rather than for packaging of DNA. This is consistent with two decades of research that has shown that there is an extraordinarily complex relationship between the structure of chromatin and the process of gene expression. It also jives with in vitro observations that yeast H3/H4 tetramers can support robust transcription, while H2A/H2B tetramers cannot.

It is possible, therefore, that as the first eukaryotes evolved, nucleosomes and chromatin started to further compact their DNA into nuclei, which among other things, helped to prevent DNA damage, and that this subsequently enabled early eukaryotes to flourish. This observation is so exciting to me because it brings up so many questions that we can actually address such as- if there are nucleosomes comprised of histones, where are the histone chaperones? And further- despite the conventional wisdom that archael nucleosomes are not post translationally modified- this remains to be confirmed (or denied) experimentally. If conventional wisdom is correct and archea histones are not post countries post-translational and modified, then when did this innovation arise? There are more than enough questions to keep the lab buzzing!

Publishing the paper
Because I truly believed that this result “would be of general interest to a broad readership” we prepared a report for Science which was returned to us within 48 hours. The turnaround from Nature was even faster. I had received emails from eLIFE several months previously, and after reading the promotional materials and the surrounding press, we took our chances s at eLIFE and hoped for the best. The best is exactly what we got. Within a few days the editors emailed that the manuscript was out for peer review and four weeks later we received the reviews. They were unique. They outlined required, non-negotiable revisions (including a complete resequencing of the genome after MNase digestion but without prior cross-linking) but contained no gray areas and required no mind-reading. With all hands on deck and we resubmitted the manuscript in four weeks and were overjoyed with its acceptance. Of course with N=1, combined with a positive outcome it’s hard to be anything but extremely positive about this new journal. But I think the optimism is defendable- the reviews were transparent, and the criticisms made it a better paper. The editorial staff was supportive gave us the opportunity to take the first stab at drafting the digest which accompanies the manuscript.

NOTE ADDED BY JONATHAN EISEN.  A preprint of the paper is available here.  Thanks to the eLife staff for helping us out with this and encouraging posting prior to formally going live on the eLife site.

What’s next and what’s in the freezer
This work represents the Haloferax reference condition, with asynchronously growing cells in rich, high-salt media. We recently collected samples of log phase cultures exposed to several environmental stresses and samples from lag, log and stationary phases of growth to chart archael nucleosome dynamics. We are also refining a home-made ribosomal depletion protocol to make constructing complementary transcriptome maps considerably cheaper. Finally, it is exciting to contemplate a consortium effort to create a systematic, barcoded set of Haloferax deletion (or disruption) mutants for systematic functional studies.

Mille grazie to Jonathan E. for inspiring me to looking at understudied microbes and for encouraging me to walk the walk with respect to publishing in open access forums. And for letting me share my thoughts as a guest on his blog

The tree of life from Haloferax’s perspective Artwork by Trine Giaever

12.12.12 on 12.12.12

Sorry – just had to have a post at 12.12.12 on 12.12.12.

Award: Ridiculous, absurd, offensive overselling of the microbiome from Chalmers & Gothenburg

Wow.  This is painful.  There is a press release that came out a few days ago: Changes in the gut bacteria protect against stroke.  In it they report on a new paper showing some interesting results comparing the metagenomes of gut microbiota in stroke patients vs healthy patients.  They found some interesting differences.  And they then made absurd, dangerous, self-serving claims that completely confuse the issue of correlation vs. causation.

Basically, they found carotenoid production genes to be more abundant in the people who were healthy.  And they then appear to have concluded that production of carotenoids by bacteria in the gut protects from strokes.  Completely ridiculous.  No evidence whatsoever is presented that such production of carotenoids by gut microbes does anything of the kind.   Compare the semi careful wording in the paper

Our finding of enriched levels of phytoene dehydrogenase in the metagenomes of healthy controls and its association with elevated levels of β-carotene in the serum may indicate that the possible production of this anti-oxidant by the gut microbiota may have a positive health benefit

To the drivel in the release

Our results indicate that long-term exposure to carotenoids, through production by the bacteria in the digestive system, has important health benefits. These results should make it possible to develop new probiotics. We think that the bacterial species in the probiotics would establish themselves as a permanent culture in the gut and have a long-term effect

As a bonus, they promote a new company of their Metabogen in the press release.   Here’s a suggestion.  Do not invest in this company and do not believe anything they do (unless they retract the claims in the PR).  The people involved in this press release, which also are associated with this company, are overselling their own work, do not seem to understand the difference between correlation and causation, and are making dangerous claims about health benefits.

And thus I am awarding them my coveted “Overselling the microbiome award.”  Past awards include:

UPDATE 1: 7:30 PM 12/11/12

Some of the other parts of the press release that are bad:

  • The title: “Changes in the gut bacteria protect against stroke.” Are you kidding me?  Ridiculous claim with no evidence.
  • Another line: “Jens Nielsen, Professor of Systems Biology at Chalmers, says that it may be preferable to take probiotics instead – for example dietary supplements containing types of bacteria that produce carotenoids.”  So now they have jumped from a correlation in what microbes are present to treating people with probiotics.  Just what priobiotics are they going to use? And is there any evidence that they help?

Guest post on "The phone microbiome" from Georgia Barguil in Jack Gilbert’s lab

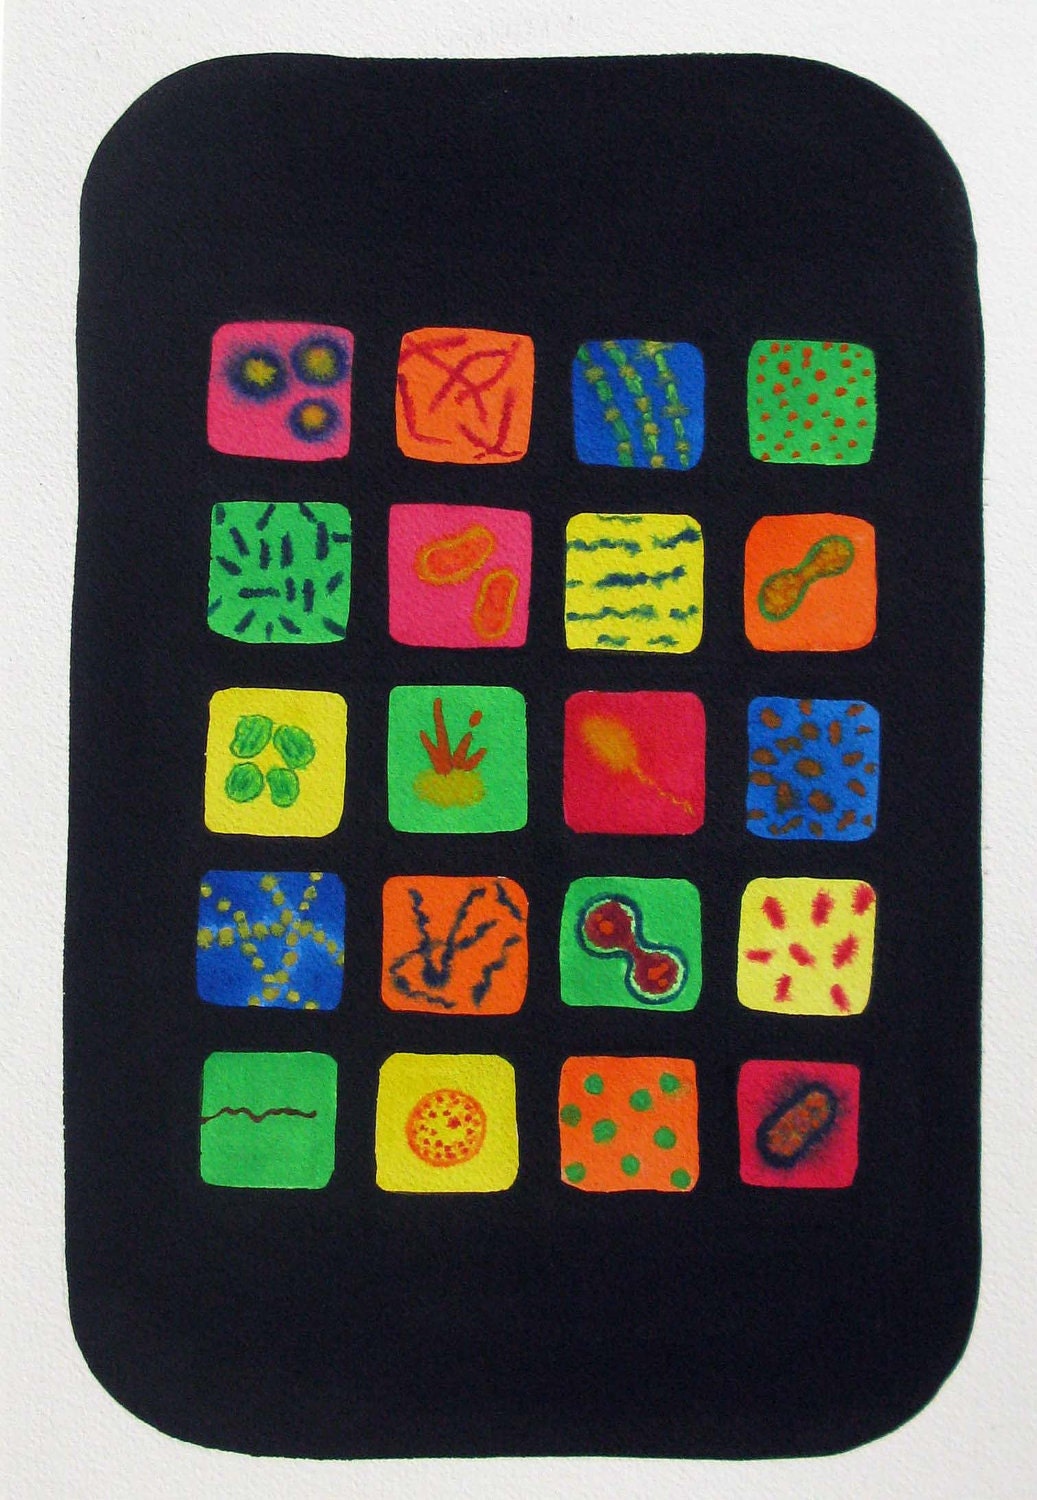
From @Artologica on Etsy.  The Phonome. 

Today we have a very special guest post from Georgia Barguil in Jack Gilbert’s group at University of Chicago / Argonne National Lab.  Georgia has been coordinating analyses of microbial surveys that have been a collaboration between me and Jack (although really driven by Jack and his lab in most ways).  The study subject: cell phones and shoes.  The study locations: conferences and meetings in order to have participation in microbial surveys by “citizen” scientists of one kind or another.  We did this together at the AAAS meeting.  And then Gilbert’s lab did this at ThirstDC.  And then I did this at SciFoo at Google HQ.  We are working on a paper on this and wanted to get some results out to the community so Georgia wrote up this post.


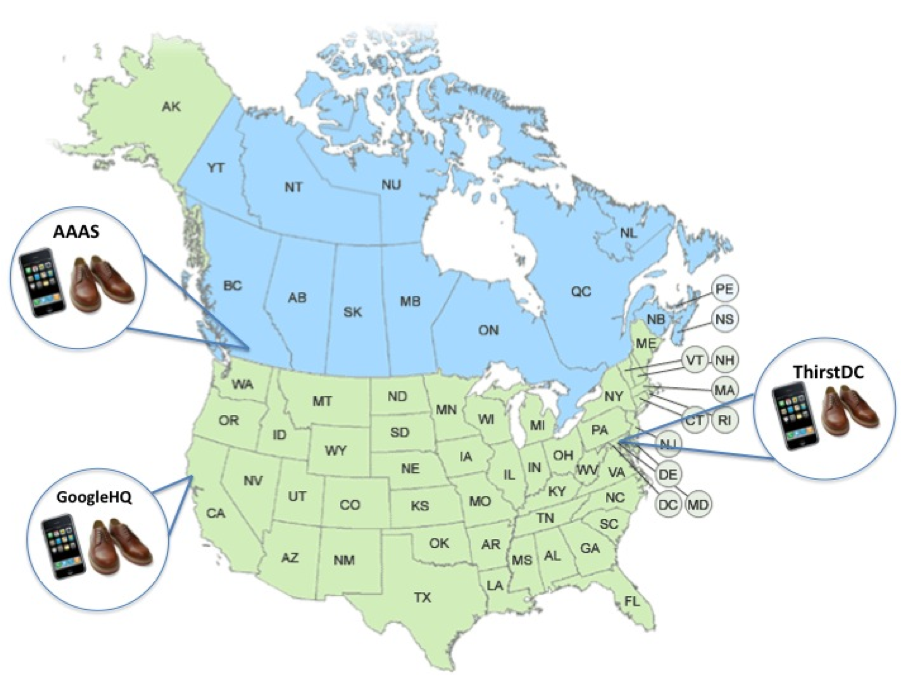
Ever wanted to know what bacteria are on your shoes and phones? Of course you have! Here we explored the bacteria that call shoes and phones home; the shoes and phones belonged to employees at Google’s Headquarters, and to participants at the Thirst DC and AAAS annual meeting conferences over 2012 (Fig. 1). Altogether, 84 phones (34 from GoogleHQ, 23 from ThirstDC and 27 from AAAS) and 68 shoes (15 from SciFoo, 24 from ThirstDC and 29 from AAAS) were sampled. The DNA of these samples was extracted and the bacteria were identified by sequencing and subsequent computational analysis of a key gene (16SrRNA) found in all bacteria. Here we show some of the results.

Fig. 1: Map showing the 3 sampling locations: AAAS in Vancouver, SciFoo in California and ThirstDC in Washington

There are quite a lot of microorganisms found in these environments, as you can see in the graph below (Fig. 2), where each bar represents a sample and each color represents a group of bacteria. Also by looking at the chart you can see that the bacteria that live on phones and shoes are different, and found in different proportions. Actually, by comparing the bacterial profile from an unidentified sample with this collection, we could tell you whether that sample was from a phone or a shoe!

Fig. 2: Genus-level diversity and abundance of bacteria associated to phone and shoe samples.

In the shoe samples you can see a lot more colors, which implies that the shoes are home to more bacterial groups than the phones. Out of 560 groups of bacteria found, there were 90 that favored either shoes or phones; 70 of these groups favored the shoe environment while the other 20 favored the phone. Some of the groups that preferred the phones were:

  • Streptococcus (dark green)- many streptococcal species are nonpathogenic, and form part of the commensal human microbiome of the mouth, skin, intestine, and upper respiratory tract.
  • Staphylococcus (brown)- most species of this genus are harmless and reside normally on the skin and mucous membranes of humans and other organisms.
  • Rothia (gray)- is a common inhabitant of the human oral cavity and respiratory tract. Some species were identified as gluten-degrading natural colonizers of the upper gastro-intestinal tract.
  • Actinomyces (army green)- normally present in the gingival area, they are part of the commensal flora, and are the cause of most common infection in dental procedures and oral abscesses. Many Actinomyces species are opportunistic pathogens of humans and other mammals, particularly in the oral cavity. In rare cases, these bacteria can cause actinomycosis, a disease characterized by the formation of abscesses in the mouth, lungs, or the gastrointestinal tract.
  • Prevotella (red)- has been a problem for dentists for years. As a human pathogen known for creating periodontal and tooth problems, Prevotella has long been studied in order to counteract its pathogenesis.
  • Gemella (bright yellow)- group of bacteria primarily found in the mucous membranes of humans and other animals, particularly in the oral cavity and upper digestive tract
  • Micrococcus (pale green)- have been isolated from human skin.
  • Corynebacterium (yellow)- occurs commonly in nature in the soil, water, plants, and food products. The non-pathogenic Corynebacterium species can even be found in the mucosa and normal skin flora of humans and animals.
  • Propionibacterium (pale blue)- members of this group are primarily facultative parasites and commensals of humans and other animals, living in and around the sweat glands, sebaceous glands, and other areas of the skin. They are virtually ubiquitous and do not cause problems for most people, but some propionobacteria have been implicated in acne and other skin conditions.

It is evident that all of these groups are commonly found in the skin and mucous membranes of humans, so it is expected that these groups occur in phones due to the close contact with the hands, face, mouth and breath.

In the plot below (Fig. 3), phones (blue squares) and shoes (orange triangles) from all sampling locations were analyzed together and you can see that phones harbor a very different community to shoes (in fact this is a statistically significant difference) – but shoes all look quite similar while phone microbiome are actually quite variable. It may be possible that the microbiome of your phone is reasonably unique to you, and that we could tell whose phones was who’s by the microbes that lived on the phone.

Fig. 3: Principal coordinate analysis (PCoA) plot using the UniFrac distance obtained for all phone (blue squares) and shoe (orange triangles) samples.

When dividing the samples according to geographical location instead of phones/shoes (Fig. 4), the three sampling locations do not form discrete clusters, and are not statistically significantly different (p>0.05), which suggests that no matter the geographical location you sample, you will find similar bacterial communities.

Fig. 4:PCoA plot using the UniFrac distance obtained for both phone and shoe samples from the 3 sampling locations. The red squares represent AAAS samples, while the blue circles and orange triangles represent SciFoo and ThirstDC, respectively.

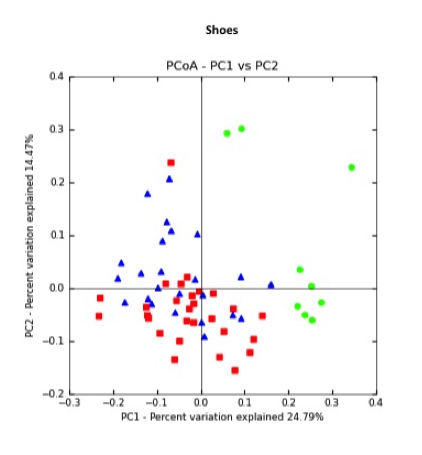
However, if we only consider the bacteria found on shoes (Fig. 5), then GoogleHQ (green circle) is statistically different from both AAAS (red square) and ThirstDC (blue triangle). This difference is mostly due to a higher abundance of Corynebacterium and Kocuria groups found in the GoogleHQ shoe samples.

Fig. 5: PCoA plot using the UniFrac distance obtained for all shoe samples from SciFoo (green circles), AAAS (red squares) and ThirstDC (blue triangles).

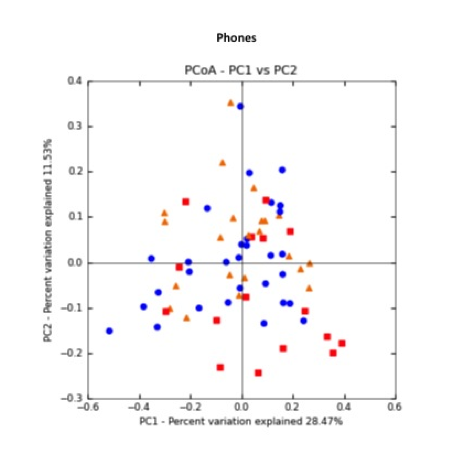
The microbiota found in phones was highly similar among the three sampling locations (Fig. 6), indicating that phones tend to harbor the same groups of microorganisms even in different locations, regardless of the phone model and owner microbiota. As it can be observed in the plot below, phone samples from AAAS (red squares), ThirstDC (orange triangles) and SciFoo (blue circles) are interspersed.

Fig. 6: PCoA plot using the UniFrac distance obtained for all phone samples in the 3 sampling locations. GoogleHQ is represented by the blue circles, while Thirst DC and AAAS are represented by orange triangles and red squares, respectively.

In conclusion, there were more biological differences between shoes and phones than between the three geographical locations. Phones and shoes harbored microbiomes representing the environments they most often came into contact with. Phones were closely related to the skin and upper respiratory tract, and shoes reflected the bacteria found in soil and the environment.

Although many of the groups found both in shoes and phones have pathogenic representatives, you should not be scared, as it does not mean that you are going to get sick. Most of the isolated, characterized and sequenced bacterial groups available in the sequence databases are the pathogenic ones, exactly because of their importance to human health by aiding in the diagnosing and treatment of diseases. Some of the “relatives” of these pathogenic bacteria are actually good-guys that are usually present in your normal microbiota and do not represent any risks, in fact they may actually be preventing the ‘bad-guys’ from growing on your phone!  On the other hand, it is always a good idea to clean your cell phone screen once in a while, just to be safe.


For some other reading about the phone sampling efforts see

Some fun holiday reading about the UC Davis Medical Center neurosurgeon saga

Well, here are some new news stories to read:

For some background see my detailed post with much of the history in the story here.
I must say, it certainly seems time to replace the administration at the UC Davis Medical Center.  The Dean is stepping down, but not for some months (see Amid controversy, Claire Pomeroy to step down as UC Davis med).  The main administrator Ann Madden Rice is still there.  I wouldn’t expect her to stay for long.

Attention all metagenomicists: put your pinky in the corner of your mouth & say "1 million dollars"

Already posted this to Twitter and Facebook but had to post here too.  This is wild.  DTRA has announced a $1 million prize for metagenomic analysis: DTRA Algorithm Challenge | Landing Page.  From their page

The Prize:
As nth generation DNA sequencing technology moves out of the research lab and closer to the diagnostician’s desktop, the process bottleneck will quickly become information processing. The Defense Threat Reduction Agency (DTRA) and the Department of Defense are interested in averting this logjam by fostering the development of new diagnostic algorithms capable of processing sequence data rapidly in a realistic, moderate-to-low resource setting. With this goal in mind, DTRA is sponsoring an algorithm development challenge. 

The Challenge:
Given raw sequence read data from a complex diagnostic sample, what algorithm can most rapidly and accurately characterize the sample, with the least computational overhead?

My instinct is to keep this to myself because, well, I want to win.  But my sharing side of things won out and I am posting here.  Maybe we (i..e, the community) can develop an open, collaborative project to do this?  Just a thought …

Get the genomes of up to 12 type strains of bacteria and/or archaea sequenced, for free

Barny Whitman asked me to post this announcement and, well, I am.  I made one edit below (see strikethrough) in honor of Norm Pace.

Genomic Sequencing of Prokaryotic Bacterial and Archaeal Type Strains

The Community Sequencing Program (CSP) Quarterly Microbial call of the DOE Joint Genomes Institute provides a great opportunity to obtain draft genomic sequences of the type strains of bacterial and archaeal species. The type strains may also include proposed species prior to publication. Type strains must be relevant to DOE mission areas, such as bioenergy, biogeochemistry, bioremediation, carbon cycling, and phylogenetic diversity. However, strains of human pathogens and human associated species are not eligible. Proposals for genome sequencing of type strains can be submitted through the CSP Quarterly Microbial call, whose deadline is December 17, 2012, with approval usually being completed within one month. Up to 12 strains can be included in each proposal. Proposals for larger numbers of strains need to be submitted to the CSP annual call in the spring. If you cannot make the December call, Quarterly calls are also scheduled for March 25, June 17, and September 23, 2013.

Proposals may be completed on-line at: http://proposals.jgi-psf.org/proposals. You will need to register and sign in to this server. Once on the server, follow the links to the “CSP Quarterly Microbial/Metagenome”. All strains will have to have been deposited in a culture collection, including proposed type strains prior to publication. If a culture collection ID is not available, you can attach a copy of the Certification of Availability. Once approved, you will need to provide 5-10 µg of high molecular weight DNA.

For questions, contact Barny Whitman, University of Georgia (whitman@uga.edu).

Further signs that microbiome work is getting hot: more $$ from NIH

Just got an email about this NIH program: RFA-RM-12-021: Evaluation of Multi-omic Data in Understanding the Human Microbiomes Role in Health and Disease (U54)

Some key points

  • Up to 3$ million per year
  • 1 or 2 awards
  • U54 Specialized Center
The human microbiome is, well, hot, and there continues to be money available to work on it …

Guest post: uBiome puts microbiome science in the hands of the people

It is a fascinating time to be doing microbiology. One of the latest occurrences is the spread of work on the human microbiome and even more recently the launching of several crowdfunding / citizen science efforts in this area. (Full disclosure – I am a collaborator on one of these efforts – the American Gut Project).  Another one of these efforts is a startup called uBiome. After seeing the announcement of their launch I asked Zac Apte, one of the founders, if he would be interested in writing a guest post for my blog on what they are doing. And, well, he agreed. And it is below (the post title “uBiome puts microbiome science in the hands of the people is from him too – I added the pic).


uBiome puts microbiome science in the hands of the people

Most people think “germs” is a dirty word. That’s what we’re taught since preschool. But the truth is that microbes aren’t just good or bad — it’s a lot more complicated than that. We are surrounded by microbes (on and inside of us) that form a complex ecosystem that supports and nourishes our health.

uBiome (www.indiegogo.com/ubiome) is a citizen science startup focused on allowing people direct access to this cutting ed research. By amassing a large set of microbiome samples along with health and lifestyle data, we will perform a microbiome-wide association study, examining specific traits as well as diseases such as diabetes, heart disease, hypertension, and depression in the context of the human microbiome.

We hope participants will join our community and track themselves in the long term — as you change your diet or exercise regime, begin taking a new medication, such as an antibiotic, or simply as you age. Now is a great time for a first data point.

Finally, we’re not just polling people for their poop. We’re also polling them for their creativity in scientific research. When our first dataset goes live, we’re going to ask our citizen scientists to form their own cohorts and we’ll empower them (statistically speaking) to test their own hypotheses. That’s our vision.

Our team has expertise in metagenomics as well as roots in population genetics, computer science, and network mathematics. We also have a team of scientific advisors which includes inventor and MacArthur Genius award winner Dr. Joseph DeRisi, biotechnology pioneer and inventor of the recombinant Hepatitis B vaccine Pablo Valenzuela, as well as doctors, bioinformaticians, and researchers.

We really appreciate Jonathan Eisen reaching out to give us this opportunity to say hello on the Tree of Life blog — and we look forward to engaging with you!

By Zac, Will and Jessica – the uBiome team

Genomics Standards Consortium meeting – GSC15, Bethesda, April 22-24, 2013

The 15th Workshop of the Genomic Standards Consortium (GSC15)

April
22-24, 2013, Bethesda, Maryland, USA.

Registration and EasyChair abstract submission website now open.

Theme: Standards-enabled Research in Genomics
URL: http://gensc.org/gc_wiki/index.php/GSC_15

The 15th Genomic Standards Consortium (GSC15) meeting will be held at
NIH (Bethesda, Maryland) from April 22-24th. This meeting will
highlight the utilization of genome metadata standards for the
enhancement of our biological understanding of microbes, the interaction
between microbial genomes, human health and disease. GSC15 will provide
a forum for standards developers, genome and metagenome researchers and
biological database developers to discuss their research, initiate
collaborations, join GSC working groups and engage in panel
discussions. The conference will include two days of plenary talks
featuring GSC projects and community standards efforts along with a
keynote speaker, discussion of standards among a government panel and
groups discussion panel. Day 3 of GSC15 will include concurrent GSC
working groups open to GSC15 participants.

Key Dates:
October 15, 2012: Registration opens, EasyChair abstract submission opens
December 20, 2012: Deadline for submission of abstracts
January 7, 2013: Decisions released on abstract
February 15, 2013: Registration closes

Abstract Submission:
Abstract for Outreach I and II session talks and GSC15 posters may be
submitted through EasyChair
(https://www.easychair.org/conferences/?conf=gsc15).

Outreach I and II and poster topics: Standards in Genomic and
Metagenomic projects. Development, integration and research findings
related to human, model organism or environmental projects, resources,
tools or databases.

Location: Natcher Conference Center, Building 45, NIH Campus, Bethesda,
Maryland, USA

For more detailed information, please visit the GSC 15 website at
gensc.org/gc_wiki/index.php/GSC_15