The Axis of Evol: Getting to the Root of DNA Repair with Philogeny
In 2005 I wrote an essay about my time in graduate school that was potentially going to be included in a special issue of Mutation Research in honor of my PhD advisor
Phil Hanawalt. Alas, publishing my essay ran into complications in regard to the closed access policies of this journal. So in the end, my essay was not published. I had forgotten about it mostly until very recently. And so I decided to convert the essay to a blog post. The essay is sort of about what I did in grad. school and sort of about Phil …
Abstract:
Phylogenomics is a field in which genome analysis and evolutionary reconstructions are integrated. This integration is important because genome data is of great value in evolutionary reconstructions, because evolutionary analysis is critical for understanding and interpreting genomic data, and because there are feedback loops between evolutionary and genome analysis such that they need to be done in an integrated manner. In this paper I describe how I developed my particular phylogenomic approach under the guidance of my Ph.D advisor Philip C. Hanawalt. Since I was the first to use the term phylogenomics in a publication, I have decided to rename the field (at least temporarily) Philogenomics.
1. Doctor of Philosophy
When I went to Stanford for graduate school, I was interested in combining evolutionary analysis and molecular biology in a way that would allow me to study molecular mechanisms through an evolutionary perspective. Although I had gone to Stanford ostensibly to work on butterfly population genetics, within two days of starting a rotation in Phil’s lab, I knew that that was where I wanted to work. This decision was somewhat traumatic, since the work on butterflies included spending the summers at 10,000 feet in the Rocky Mountains and possibly chasing butterflies like a Nabakov wanna-be all over the mountain ranges of the world. As an avid outdoor person, this was quite appealing. Nevertheless, I chose to spend 99% of my graduate work in the dingy confines of Herrin Hall, studying DNA repair. The choice of joining Phil’s lab did have one very positive affect – and that was on my relationship with my grandfather on my mother’s side. Benjamin Post was in many ways like a father to me, especially after my father passed away. He was a physicist from the “old school” and thought that most of biology was completely useless. Needless to say, when I told him I was going to graduate school in California (which he considered already one strike against me) to study butterflies, he decided I was simply a lost cause. Despite all his talk of Einstein and computers and math when I was a child, I might as well have been a poet from his point of view. To make matters worse, my grandfather was a crystallographer, and my brother was getting his Ph.D in crystallography at Harvard. When I informed my grandfather that I was going to be working on DNA repair, he seemed somewhat interested. And then I told him, my advisor, Phil Hanawalt, is relatively well known, and actually used to be considered a biophysicist. Then my grandfather really perked up. He said, “Hanawalt – is he related to Don Hanawalt?” It turns out, that my grandfather worked in the same field as Phil’s father (they both did powder diffraction) and knew him. So my grandfather said “You may not be doing real science, but at least you are doing it with the relative of a real scientist.” Thankfully, I was no longer the black sheep in the family. So, with my grandfather’s approval, I embarked on a career in DNA repair.
I would like to add that I was very torn in writing this article. On the one hand, Phil was the greatest advisor I could ever imagine, allowing me to pursue studies on the evolution of DNA repair and comparative genomic analysis, even though nobody else in the lab worked on such things and at times, nobody seemed interested in them either. Phil’s support allowed me to explore my own interests and develop my concepts for the idea of “Phylogenomics” or the combining of evolutionary reconstructions and genome analysis. On the other hand, this special issue is being published in an Elsevier journal. As a supporter of the Open Access movement on scientific publications (see
http://www.plos.org) and the brother of one of the founders of the Public Library of Science, publishing in an Elsevier journal is like cavorting with the devil. But the pull of Phil is very strong (some strange sort of force actually) and despite the effects that this may have on my relationship with my brother, I have agreed to publish in this special issue, and thus can now say that I sold my soul for Phil Hanawalt. [[OOPS – Spoke too soon on this when I wrote it — in the end I just could not sign on the dotted line]].
In this essay, I describe my development in Phil’s lab of the idea of “Phylogenomics” or the combination of evolutionary reconstructions and genome analysis. I would like to add that this is not an attempt to review the field of phylogenomics or all the studies that could be called phylogenomics of DNA repair. For that I recommend reading other papers by myself (some of which are discussed below) as well as those by Rick Wood [1-4]}, Janusz M Bujnicki [5], Eugene Koonin [6-14]}, Carlos Menck [15-18], Michael Lynch [19-21], Patrick Forterre [22-24], Nancy Moran [25-29], and others. This is just meant to review my angle on the phylogenomics of repair and Phil’s contribution to this.
2. RecAgnizing the value of evolutionary analysis in studies of DNA repair
A post-doc in Phil’s lab at the time I was there, Shi-Kau (now known as Scott) Liu was working on analysis of some studies of recA mutants he had done while working in Irwin Tessman’s lab. He asked me if I could help him with some comparative analyses of RecA protein sequences from different species, in the hopes that this might help interpret his experimental data. We then downloaded and aligned all available RecA protein sequences from different species of bacteria and compared the sequence variation to the recently solved crystal structure of a form of the E. coli RecA protein. Specifically we were looking for compensatory mutations in which there was a change in one amino-acid in the region there was a correlated change in another amino-acid in the same region (these were detected using an evolutionary method called character-state reconstruction). Interestingly, in some regions of the crystal structure (e.g., the monomer-monomer contact regions) extensive compensatory mutations could be detected, suggesting that this region of the crystal was conserved between species. In other regions of the crystal (e.g., the filament-filament contact regions), no compensatory mutations could be detected suggesting either that this region of the structure was not conserved between species or that the filament contact regions were some artifact of crystallization. This was important to show since the mutations Shi-Kau was looking at were suppressors of another recA mutant (recA1202) and the suppressors we found did not make complete sense if the filament-filament contact regions of the crystal reflected perfectly what was going on in-vivo (30).
In this way, evolutionary reconstructions helped inform experimental studies in E. coli. While this concept was not necessarily novel, it is important to point out that most molecular sequence comparisons used for structure-function studies both then and now focus on sequence conservation (that is, what is identical or similar between sequences). This does not take full advantage of the evolutionary history of sequences since it does not specifically examine how the sequence conservation came to be (that is, it does not look at the amino-acid changes that occurred, just what is conserved). This made me realize that comparative analysis (identifying what is similar or different between genes or species) was fundamentally different from evolutionary reconstructions (which can identify how and possibly even why the similarities and differences came into being). I should point out that to do the compensatory mutation analysis well requires lots of sequences and this was one of the hidden reasons behind why I have pushed for ten years for people studying the evolutionary relationships among microbes to use recA as a marker as they use rRNA (31).
3. Sniffing around at homologs of repair genes
Shortly after the recA analysis was complete, another problem being addressed in the Hanawalt lab presented an even more powerful test for evolutionary reconstructions. Kevin Sweder, another post-doc in the lab, was working on yeast strains with defects in homologs of human DNA repair genes. It was at this time that many of the human DNA repair genes were being cloned and shown to be members of the helicase superfamily of proteins. Many of these could further be assigned to one particular subfamily within the helicase superfamily – the subfamily that contained the yeast SNF2 protein. Proteins in the SNF2 family could be readily identified because their helicase-like domains were all much more similar to each other than any were to other helicase-domain containing proteins. Yet many scientists, including Kevin, were presented with a problem. As the yeast genome was being completed, blast searches could identify that yeast encoded many proteins in the SNF2 family. However, these same blast searches could not readily identify which yeast gene was the orthologs of which human gene. For those who do not know, homologous genes or proteins come in two primary forms – paralogs, which are genes related by gene duplications (e.g., alpha and beta globin) and orthologs, which are the same form of a gene in different species (e.g., human and mouse alpha-globin). Thus if one wanted to use yeast as a model to study a human disease due to a mutation in a SNF2 homolog, it would be helpful to know which yeast gene was the ortholog of the human gene of interest. Since paralogs are related to each other by duplication events and since duplication events are an evolutionary event, I figured that an evolutionary tree of the SNF2 family proteins might help divide the gene family into groups of orthologs.
Indeed, this is exactly what we found – the SNF2 family could be divided into many subfamilies, each of which contained a human and a yeast gene and thus these genes could be considered orthologs of each others. In our analysis we found something even more striking. For every subfamily in the SNF2 superfamily, if the function of more than one member of the subfamily was known (e.g., the human and yeast genes), the function was always conserved. Also, all different subfamilies appeared to have different functions (32). Thus one could predict the function of a gene by which subfamily in which it resided. As with the analysis of RecA, it should be pointed out that the phylogenetic tree-based assignment of genes to subfamilies was more useful than blast searches because blast is simply a way to identify similarity among genes/proteins. The tree allows one to group genes into correct subfamilies even if rates and patterns of evolution have changed over time and are different in different groups. Again, this is a distinction between comparative analysis and evolutionary analysis.
4. A gut feeling leads to the idea of “Phylogenomics”
With the SNF2 analysis as a backdrop, I proceeded to proselytize to anyone who would listes, that phylogenetic trees of genes were going to revolutionize genomic sequencing proteins by allowing one to predict the functions of many unknown genes. Genome sequencing projects of course product lots of sequence data and little functional information. Although most of the people in the Hanawalt lab (except maybe Phil) could not have cared less about my evolutionary rantings, fortunately for me, one person called my bluff. Rick Myers, a professor in the Stanford Medical School and one of the heads of the Stanford Human Genome Center was asked to write a News and Views for Nature Medicine about the recent publications of the genomes of E. coli O157:H7 and Helicobacter pylori. So Rick challenged me and said I should try and come up with a real example of how the people who worked on these genomes screwed something up by not doing an evolutionary analysis. Fortunately, it was easy to find an interesting case to study in one of the genomes. In the H. pylori paper, the authors had predicted that the species should have mismatch repair but then reported something quite unusual – the genome encoded a homolog of MutS but did not encode a homolog of MutL. I suppose this should have raised a red-flag to them since all species known to have mismatch repair required homologs of both of these proteins for the process. While some species had other bells and whistles (e.g., the use of MutH and Dam in gamma proteobacteria), the use of MutS and MutL was absolutely conserved. An evolutionary tree of the MutS homologs available at the time including the one in H. pylori also suggested a red-flag should have been raised before predicting that this species possessed mismatch repair.
The MutS family in prokaryotes could be divided into two separate subfamilies, which I called MutS1 and MutS2. All genes known to be involved in mismatch repair were in the MutS1 family. No gene in the MutS2 family had a known function. The H. pylori gene was in the MutS2 family. So this species had no MutL and a MutS homolog in a novel subfamily. To us, this suggested that it would be a bad idea to predict the presence of mismatch repair in this species (33). Later, I showed that there was a general trend – all prokaryotes with just a MutS2-like protein did not have a MutL-homolog, and all species with a MutS1-like protein did (34-36). Experimental work has now shown that the MutS2 of H. pylori is not involved in MMR and that this species apparently does not have any MMR (37). This is important because this apparently causes this species to have an exceptionally high mutation rate, which in turn can effect how one designs vaccines and drugs and diagnostics to target it. It should be pointed out that the role of the MutS2 homologs is not known although they have been knocked out in many species and as of yet none have a role in MMR. Thus predicting function by evolutionary analysis (or more specifically, not incorrectly predicting function) can be of great practical value.
It is from this analysis that I came up with the idea of “Phylogenomics” or the integration of evolutionary reconstructions and genome analysis (34-36). These approaches should be fully integrated because there is a feedback loop between them such that they cannot be done separately. For example, in the studies of MutS and MutL it is necessary to do a genome analysis to identify the presence or absence of homologs of these genes, then an evolutionary analysis to determine which forms of each of the genes are present, then a genome analysis again to determine the number and combination of different forms and then an evolutionary analysis to determine whether and when particular forms were gained and lost over evolutionary time, and so on.
5. Lions and TIGRs and bears
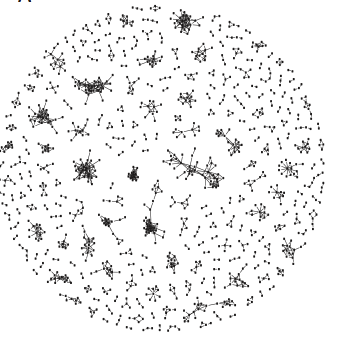
Since leaving Phil’s lab I have been a faculty member at The Institute for Genomic Research (TIGR) and in that time we have found dozens of new uses for a phylogenomic approach and designed many new methods to implement phylogenomics. Such an approach has led to many interesting findings relating to DNA repair. Phylogenetic analysis of eukaryotic genomes has allowed us to identify many nuclear encoded genes that are homologs of DNA repair genes but appear to evolutionary derived from the organellar genomes and thus are good candidates for still having a role in DNA repair in the organelles (38). These include both putatively plastid-derived genes (encoding RecA, Mfd, Fpg, RecG, MutS2, Phr, Lon) and mitochondrial-derived genes (encoding RecA, Tag). Interestingly the presence of Mfd but not UvrABCD is also found in many endosymbiotic bacteria, although the explanation for what this Mfd might be doing is unclear. Phylogenomic analysis has allowed us to identify the loss of important DNA repair genes in various species such as the apparent loss of all the genes for non-homologous end joining in the causative agent of malaria, Plasmodium falciparum (39). An important component of this analysis was the finding that this species did not have an orthologs of DNA ligase IV, even though the original annotation of the genome had suggested it did (Figure 1).
 |
| Figure 1. Phylogenetic tree of DNA ligase homologs showing the presence of an orthologs of DNA Ligase I in Plasmodium falciparum but no orthologs of DNA ligase IV, consistent with the absence of non homologous end joining. |
Among the other interesting repair-related features we have found are: the presence of two MutL homologs in an intracellular bacteria Wolbachia pipientis wMel (40), the presence of two UvrA homologs in Deinococcus radiodurans (41) and Chlorobium tepidum (42), the absence of MutS and MutL from Mycobacterium tuberculosis(43), and the presence of multiple ligases for each chromosome in Agrobacteriumtumefaciens (44). Continued surprises come from almost every genome.
However, all is not good in the world of phylogenomics. One of the biggest problems is that most of the experimental studies of DNA repair that have formed the basis of out knowledge in the field have been done in a narrow range of species. For example, there are estimated to be over 100 major divisions of bacteria (Phyla) and of these, most DNA repair studies have been restricted to three of these phyla (Proteobacteria, Firmicutes (also known as lowGC Gram-positives), and Actinobacteria (also known as highGC Gram positives). This means that if anything novel evolved in any of the other lineages, we would not know about it. This probably explains why, when we sequenced the genome of the radiation resistant bacteria D. radiodurans, analysis of the homologs of DNA repair genes in the genome did reveal many homologs of known repair genes but this list did not have many features that were unusual compared to non radiation resistant species (Table 1) and thus was not of much use in understanding what makes this species so resistant (41).
Table 1. Homologs of known DNA repair genes identified in the initial analysis of the D. radiodurans genome sequence
|
Process
|
Genes in D. radiodurans
|
Unusual features
|
|
Nucleotide Excision Repair
|
UvrABCD, UvrA2
|
UvrA2 not found in most species
|
|
Base Excision Repair
|
AlkA, Ung, Ung2, GT, MutM, MutY-Nths, MPG
|
More MutY-Nths than most species
|
|
AP Endonuclease
|
Xth
|
–
|
|
Mismatch Excision Repair
|
MutS, MutL
|
–
|
|
Recombination
Initiation
Recombinase
Migration and resolution
|
RecFJNRQ, SbcCD, RecD
RecA
RuvABC, RecG
|
–
|
|
Replication
|
PolA, PolC, PolX, phage Pol
|
PolX not in many bacteria
|
|
Ligation
|
DnlJ
|
–
|
|
dNTP pools, cleanup
|
MutTs, RRase
|
–
|
|
Other
|
LexA, RadA, HepA, UVDE, MutS2
|
UvDE not in many bacteria
|
This of course means that genome sequencing and analysis, even if done in a robust way, only works well if there is a core of experimental studies on which to base the analysis.
In the end, I would like to define a new word – philogenomics which is the combination of studies of evolution, genomics, DNA repair, thymine metabolism, and punning. The ultimate proof of a philogenomic approach, of course, will come when it figures out the mechanism underlying thymineless death. But that is another story.
6. Acknowledgements
I would like to thank Philip C. Hanawalt for his support during and after my Ph.D research in his lab. Everyone in the field knows he is a great scientist. What they may not all know is that he is an even better human being.
References
1] Wood, R.D., DNA repair in eukaryotes. Annu Rev Biochem, 1996. 65: p. 135-167.
[2] Wood, R.D., Nucleotide excision repair in mammalian cells. J. Biol. Chem., 1997. 272(38): p. 23465-23468.
[3] Wood, R.D. and M.K. Shivji, Which DNA polymerases are used for DNA-repair in eukaryotes? Carcinogenesis, 1997. 18(4): p. 605-610.
[4] Wood, R.D., et al., Human DNA repair genes. Science, 2001. 291(5507): p. 1284-9.
[5] Kurowski, M.A., et al., Phylogenomic identification of five new human homologs of the DNA repair enzyme AlkB. BMC Genomics, 2003. 4(1): p. 48.
[6] Aravind, L., D.R. Walker, and E.V. Koonin, Conserved domains in DNA repair proteins and evolution of repair systems. Nucleic Acids Res, 1999. 27(5): p. 1223-1242.
[7] Kulaeva, O.I., et al., Identification of a DinB/UmuC homolog in the archeon Sulfolobus solfataricus. Mutat Res, 1996. 357(1-2): p. 245-53.
[8] Gorbalenya, A.E. and E.V. Koonin, Superfamily of UvrA-related NTP-binding proteins. Implications for rational classification of recombination/repair systems. J Mol Biol, 1990. 213(4): p. 583-91.
[9] Gorbalenya, A.E., et al., Two related superfamilies of putative helicases involved in replication, recombination, repair and expression of DNA and RNA genomes. Nucleic Acids Res, 1989. 17(12): p. 4713-4730.
[10] Makarova, K.S., et al., A DNA repair system specific for thermophilic Archaea and bacteria predicted by genomic context analysis. Nucleic Acids Res, 2002. 30(2): p. 482-96.
[11] Makarova, K.S., et al., Genome of the extremely radiation-resistant bacterium Deinococcus radiodurans viewed from the perspective of comparative genomics. Microbiol Mol Biol Rev, 2001. 65(1): p. 44-79.
[12] Aravind, L. and E.V. Koonin, Prokaryotic homologs of the eukaryotic DNA-end-binding protein Ku, novel domains in the Ku protein and prediction of a prokaryotic double-strand break repair system. Genome Res, 2001. 11(8): p. 1365-74.
[13] Aravind, L. and E.V. Koonin, The alpha/beta fold uracil DNA glycosylases: a common origin with diverse fates. Genome Biol, 2000. 1(4): p. RESEARCH0007.
[14] Aravind, L., K.S. Makarova, and E.V. Koonin, SURVEY AND SUMMARY: holliday junction resolvases and related nucleases: identification of new families, phyletic distribution and evolutionary trajectories. Nucleic Acids Res, 2000. 28(18): p. 3417-32.
[15] Menck, C.F., Shining a light on photolyases. Nat Genet, 2002. 32(3): p. 338-9.
[16] Simpson, A.J., et al., The genome sequence of the plant pathogen Xylella fastidiosa. The Xylella fastidiosa Consortium of the Organization for Nucleotide Sequencing and Analysis. Nature, 2000. 406(6792): p. 151-7.
[17] Morgante, P.G., et al., Functional XPB/RAD25 redundancy in Arabidopsis genome: characterization of AtXPB2 and expression analysis. Gene, 2005. 344: p. 93-103.
[18] Martins-Pinheiro, M., et al., Different patterns of evolution for duplicated DNA repair genes in bacteria of the Xanthomonadales group. BMC Evol Biol, 2004. 4(1): p. 29.
[19] Estes, S., et al., Mutation accumulation in populations of varying size: the distribution of mutational effects for fitness correlates in Caenorhabditis elegans. Genetics, 2004. 166(3): p. 1269-79.
[20] Denver, D.R., et al., Mutation rates, spectra, and hotspots in mismatch repair-deficient Caenorhabditis elegans. Genetics, 2005.
[21] Denver, D.R., S.L. Swenson, and M. Lynch, An evolutionary analysis of the helix-hairpin-helix superfamily of DNA repair glycosylases. Mol Biol Evol, 2003. 20(10): p. 1603-11.
[22] Forterre, P., Displacement of cellular proteins by functional analogues from plasmids or viruses could explain puzzling phylogenies of many DNA informational proteins. Mol Microbiol, 1999. 33(3): p. 457-65.
[23] Cohen, G.N., et al., An integrated analysis of the genome of the hyperthermophilic archaeon Pyrococcus abyssi. Mol Microbiol, 2003. 47(6): p. 1495-512.
[24] Bouyoub, A., et al., A putative SOS repair gene (dinF-like) in a hyperthermophilic archaeon. Gene, 1995. 167(1-2): p. 147-149.
[25] Moran, N.A. and A. Mira, The process of genome shrinkage in the obligate symbiont Buchnera aphidicola. Genome Biol, 2001. 2(12): p. RESEARCH0054.
[26] Dale, C., et al., Loss of DNA recombinational repair enzymes in the initial stages of genome degeneration. Mol Biol Evol, 2003. 20(8): p. 1188-94.
[27] van Ham, R.C., et al., Reductive genome evolution in Buchnera aphidicola. Proc Natl Acad Sci U S A, 2003. 100(2): p. 581-6.
[28] Moran, N.A. and J.J. Wernegreen, Lifestyle evolution in symbiotic bacteria: insights from genomics. Trends in Ecology and Evolution, 2000. 15(8): p. 321-326.
[29] Moran, N.A., Accelerated evolution and Muller’s rachet in endosymbiotic bacteria. Proc Natl Acad Sci U S A, 1996. 93(7): p. 2873-8.
[30] Liu SK, Eisen JA, Hanawalt PC, Tessman IW. 1993. recA mutations that reduce the constitutive coprotease activity of the RecA1202(PrtC) protein: possible involvement of interfilament association in proteolytic and recombination activities. J. Bacteriol. 175: 6518-6529.
[31] Eisen JA. 1995. The RecA protein as a model molecule for molecular systematic studies of bacteria: comparison of trees of RecAs and 16S rRNAs from the same species. J. Mol. Evol. 41: 1105-1123.
[32] Eisen JA, Sweder KS, Hanawalt PC. 1995. Evolution of the SNF2 family of proteins: subfamilies with distinct sequences and functions. Nucl. Acids Res. 23: 2715-2723.
[33] Eisen JA, Kaiser D, Myers RM. 1997. Gastrogenomic delights: a movable feast. Nature Medicine 3: 1076-1078.
[34] Eisen JA. 1998. Phylogenomics: improving functional predictions for uncharacterized genes by evolutionary analysis. Genome Res. 8: 163-167.
[35] Eisen JA. 1998. A phylogenomic study of the MutS family of proteins. Nucl. Acids Res. 26: 4291-4300.
[36] Eisen JA. Hanawalt PC. 1999. A phylogenomic study of DNA repair genes, proteins, and processes. Mut. Res. 435: 171-213.
[37] Bjorkholm B, Sjolund M, Falk PG, Berg OG, Engstrand L, Andersson DI. 2001. Mutation frequency and biological cost of antibiotic resistance in Helicobacter pylori. Proc Natl Acad Sci U S A. 98(25):14607-12.
[38] Britt AB, Eisen JA. 2000. DNA repair and recombination. In ‘Analysis of the genome sequence of the flowering plant Arabidopsis thaliana.’Nature 408: 796-815.
[39] Gardner MJ, Hall N, Fung E, White O, Berriman M, Hyman RW, Carlton JM, Pain A, Nelson KE, Bowman S, Paulsen IT, James K, Eisen JA, Rutherford K, Salzberg SL, Craig A, Kyes S, Chan MS, Nene V, Shallom SJ, Suh B, Peterson J, Angiuoli S, Pertea M, Allen J, Selengut J, Haft D, Mather MW, Vaidya AB, Martin DM, Fairlamb AH, Fraunholz MJ, Roos DS, Ralph SA, McFadden GI, Cummings LM, Subramanian GM, Mungall C, Venter JC, Carucci DJ, Hoffman SL, Newbold C, Davis RW, Fraser CM, Barrell B. 2002. Genome sequence of the human malaria parasite Plasmodium falciparum. Nature 419: 498-511.
[40] Wu M, Sun L, Vamathevan J, Riegler M, Deboy R, BrownlieJ, McGraw E, Mohamoud Y, Lee P, BerryK, Khouri HM, Paulsen IT, Nelson KE, Martin W, Esser C, Ahmadinejad N, Wiegand C, Durkin AS, Nelson WC, Beanan MJ, Brinkac LM, DaughertySC, Dodson RJ, Gwinn M, Kolonay JF, Madupu R, Craven MB, Utterback T, WeidmanJ, Nierman WC, Aken SV, Tettelin H, O’Neill S, Eisen JA. 2004. Phylogenomics of the reproductive parasite Wolbachia pipientis wMel: a streamlined genome massively infected with mobile genetic elements. PLOS Biology 2: 327-341.
[41] White O, Eisen JA, Heidelberg JF, Hickey EK, Peterson JD, Dodson RJ, Haft DH, Gwinn ML, Nelson WC, Richardson DL, Moffat KS, Qin H, Jiang L, Pamphile W, Crosby M, Shen M, Vamathevan JJ, Lam P, McDonald L, Utterback T, Zalewski C, Makarova KS, Aravind L, Daly MJ, Minton KW, Fleischmann RD, Ketchum KA, Nelson KE, Salzberg SL, Smith HO, Venter JC, Fraser CM. 1999. Genome sequence of the radioresistant bacterium Deinococcus radiodurans R1. Science 286: 1571-1577.
[42] Eisen JA, Nelson KE, Paulsen IT, Heidelberg JF, Wu M, Dodson RJ, Deboy R, Gwinn ML, Nelson WC, Haft DH, Hickey EK, Peterson JD, Durkin AS, Kolonay JL, Yang F, Holt I, Umayam LA, Mason T, Brenner M, Shea TP, Parksey D, Nierman WC, Feldblyum TV, Hansen CL, Craven MB, Radune D, Vamathevan J, Khouri H, White O, Venter JC, Gruber TM, Ketchum KA, Tettelin H, Bryant DA, Fraser CM. 2002. The complete genome sequence of Chlorobium tepidum TLS, a photosynthetic, anaerobic, green-sulfur bacterium. Proc. Natl. Acad. Sci. USA 99: 9509-9514.
[43] Fleischmann RD, Alland D, Eisen JA, Carpenter L, White O, Peterson J, DeBoy R, Dodson R, Gwinn M, Haft D, Hickey E, Kolonay JF, Nelson WC, Umayam LA, Ermolaeva M, Salzberg SL, Delcher A, Utterback T, Weidman J, Khouri H, Gill J, Mikula A, Bishai W, Jacobs WR Jr, Venter JC, Fraser CM. 2002. Whole-genome comparison of Mycobacterium tuberculosis clinical and laboratory strains. J. Bacteriol.184: 5479-5490.
[44] Wood DW, Setubal JC, Kaul R, Monks DE, Kitajima JP, Okura VK, Zhou Y, Chen L, Wood GE, Almeida Jr. NF, Woo L, Chen Y, Paulsen IT, Eisen JA, Karp PD, Bovee Sr. D, Chapman P, Clendenning J, Deatherage G, Gillet W, Grant C, Kutyavin T, Levy R, Li M-J, McClelland R, Palmieri A, Raymond C, Rouse G, Saenphimmachak C, Wu Z, Romero P, Gordon D, Zhang S, Yoo H, Tao Y, Biddle P, Jung M, Krespan W, Perry M, Gordon-Kamm B, Liao L, Kim S, Hendrick C, Zhao Z-Y, Dolan M, Chumley F, Tingey SC, Tomb J-F, Gordon MP, Olson MV, Nester EW. 2001. The genome of the natural genetic engineer Agrobacterium tumefaciens C58. Science 294: 2317-2323.