Some links on "ortholog conjecture" paper and critiques of it

Recently a paper by Matt Hahn was published in PLoS Computational Biology entitled “Testing the ortholog conjecture with comparative functional genomic data from mammals.”  The paper created a bit of a stir as some aspects of it call into question some of the standard assumptions made in comparative genomic analysis.

I alas do not have time to go into all the details but fortunately others have tackled this and I am posting some links here:

http://friendfeed.com/erickmatsen/f90bd2c6/emergentnexus-i-think-what-you-were-talking?embed=1

Will try to post my own comments soon.  I note – I am skeptical of their conclusions but still going through the paper to understand everything before commenting in more detail.

Playing around with CloVR – cloud computing bioinformatics system

Nice new tool/resource available out there for metagenomic and genomic analysis called CloVR: CloVR: A virtual machine for automated and portable sequence analysis from the desktop using cloud computing
It is available at http://clovr.org and it should be useful to many people out there doing genomics and metagenomics if you want to make use of cloud computing resources.

CloVR is brought to us by Florian Fricke and Owen White and Sam Angiuoli and others from the University of Maryland (full disclosure – many of the authors are ex-colleagues of mine from TIGR).

Not only is Clovr available openly and freely but they even have a Clovr blog: http://clovr.org/category/blog/ … though it does not seem to be heavily used.  Kudos to this team for producing and releasing this software for others to use.  And kudos to NSF, USDA and NIH for funding its development — I have a feeling many people will use it.

I think that I shall never see – metagenomic analysis as lovely as a tree #PhylogenyRules #PLoSOne

ResearchBlogging.org

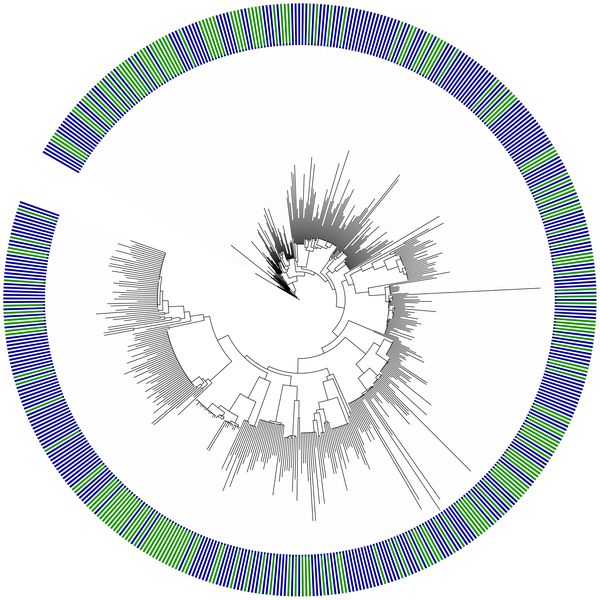
Figure 2. Phylogenetic tree linking
metagenomic sequences from 31 gene
families  along an oceanic depth gradient
 at the HOT ALOHA site

I am a co-author on a new paper that came out in PLoS One yesterday.  The paper is PLoS ONE: The Phylogenetic Diversity of Metagenomes and the full citation is Kembel SW, Eisen JA, Pollard KS, Green JL (2011) The Phylogenetic Diversity of Metagenomes. PLoS ONE 6(8): e23214. doi:10.1371/journal.pone.0023214.

The first author is Steven Kembel, a brilliant post doc at the University of Oregon.  You can follow him on twitter here. This paper is a product of the “iSEEM” “integrating statistical, ecological and evolutionary approaches to metagenomics” collaboration between my lab and the labs of Jessica Green at U. Oregon and Katie Pollard at UCSF.  For more on iSEEM see http://iseem.org.  iSEEM was supported by the Gordon and Betty Moore Foundation.

Anyway – the paper focuses on developing and using a new method for assessing the phylogenetic diversity of microbes via in samples via analysis of metagenomic data.  Phylogenetic diversity (aka PD) is measured by building evolutionary trees and summing up the total length of branches in such trees.  It is an important diversity metric and is complementary to metrics such as “species richness” which is a measure of the number of species in a sample. When one counts species in a sample, one ends up ignoring the evolutionary distances between species and thus one may get an incomplete picture of the diversity of organisms in a sample simply by counting species.  For example, a sample that contains 500 different species in the genus Escherichia would have the same “richness” as a sample that contained one representative of each of 500 different Orders of bacteria.  For many purposes it is useful to know whether one has a phylogenetically diverse sample or not.  (And of course, if one just focuses on species richness it is also important to not simply ignore some set of organisms in the samples as has sort of been done in a recent paper estimating the total species richness on the planet).  But that is not the point here – the point here is that counting species, even if done correctly, can give an incomplete picture of the diversity of organisms in sample.

For many years researchers have been attempting to measure phylogenetic diversity of various organisms in various samples.  And to do this one needs an evolutionary tree of the organisms in order to then measure branch length in the tree.  There is actually a relatively rich history of researchers attempting to look at PD in studies of microbes – especially in cases where one has access to a rRNA tree for the organisms / samples in question.  Examples of past work on this include:

What we wanted to do here was use metagenomic data to assess phylogenetic diversity of samples.  And in particular we wanted to do this with genes other than rRNA genes (e.g., protein coding genes).  There were multiple challenges in being able to do this (e.g., see a blog post I made about this issue a few years ago asking for community input).  Fortunately, Kembel has worked previously on multiple issues relating to phylogenetic diversity and phylogenetic ecology and his work led to this paper.

I note, as an aside, I have created a Mendeley group focusing on phylogenetic analysis of metagenomes and have added a diversity of papers to the collection:

http://www.mendeley.com/groups/1152921/_/widget/29/2/

In the paper Steve basically started with some of the notions and the code from AMPHORA which was designed by Martin Wu (when he was in my lab).  AMPHORA automatically infers phylogenetic trees of a set of 31 protein coding genes – and it can do this from genomic or metagenomic data. 
AMPHORA was designed to build phylogenetic trees of metagenomic sequences individually – in order to classify reads from samples to infer from what organism they likely came
But that is not what Steven wanted to do here.  What he wanted to do was infer phylogenetic trees from metagenomic samples where ALL the organisms in the sample were included in the same tree.  This was / is challenging for many reasons and this is what I had written the blog post about previously.  One issue we had was the fact that sequences might not overlap with each other and thus including them in a single phylogenetic tree together was complicated.  
From my earlier post:
The challenge with this is really two things. First, we want to analyze just the reads themselves (i.e., we do not want to use assemblies you can make from this type of data). Second, and more importantly, we want to include in our analysis sequence reads that only cover small, not necessarily overlapping regions of the “full length” sequence alignments for the family. 

The alignment would look something like

    sequence 1 XXXXXXXXXXXXXXXXXXXXXXXXXXXXXXXXXX
    fragment 1 XXXXXXXXX————————-
    sequence 2 XXXXXXXXXXXXXXXXXXXXXXXXXXXXXXXXXX
    fragment 2 ———XXXXXXXXXXXX————-
    fragment 3 ———————XXXXXXXXXXXXX
    fragment 4 —-XXXXXXXXXXXXXXXXXX————
    sequence 3 XXXXXXXXXXXXXXXXXXXXXXXXXXXXXXXXXX
    sequence 4 XXXXXXXXXXXXXXXXXXXXXXXXXXXXXXXXXX
    sequence 5 XXXXXXXXXXXXXXXXXXXXXXXXXXXXXXXXXX
    fragment 5 ———————–XXXXXXXXXXX- 
    where Xs are the regions covered by the sequences/fragments (could be DNA or amino acids)


We want to build trees from these alignments with the hope of using them to learn lots of cool things about the evolution of the fragments and the species from which they come. I can provide more information but really the key part for the phylogenetics here is the nature of the alignment.

In the past, I have decided to constrain my analyses to NOT deal with this type of alignments. I have either analyzed each fragment on its own or we have built a multiple alignment but only inlcuded fragments that cover more than 3/4 of the full length sequence and thus the matrix is much more filled out. Such an alignment would look like this

    sequence 1 XXXXXXXXXXXXXXXXXXXXXXXXXXXXXXXXXX
    fragment 1 XXXXXXXXXXXXXXXXXXXXXXXXXXX——-
    sequence 2 XXXXXXXXXXXXXXXXXXXXXXXXXXXXXXXXXX
    fragment 2 –XXXXXXXXXXXXXXXXXXXXXXXX——–
    fragment 3 —–XXXXXXXXXXXXXXXXXXXXXXXXXXXXX
    fragment 4 —-XXXXXXXXXXXXXXXXXXXXXXXXXXXX–
    sequence 3 XXXXXXXXXXXXXXXXXXXXXXXXXXXXXXXXXX
    sequence 4 XXXXXXXXXXXXXXXXXXXXXXXXXXXXXXXXXX
    sequence 5 XXXXXXXXXXXXXXXXXXXXXXXXXXXXXXXXXX
    fragment 5 –XXXXXXXXXXXXXXXXXXXXXXXXXXXXXXX- 

But we really want to include the smaller fragments in our analysis. And we are just not certain how to best do this. We know LOTs of people out there think of similar problems in terms of sparse matrices, supermatrices, supertrees, EST data, etc. And we have ideas about how to do this and are asking around by email some phylogenetics gurus we know. But I thought it might be fun to have the discussion on a blog rather than by email.

So again, how might one best build phylogenetic trees from data that looks like this?

    sequence 1 XXXXXXXXXXXXXXXXXXXXXXXXXXXXXXXXXX
    fragment 1 XXXXXXXXX————————-
    sequence 2 XXXXXXXXXXXXXXXXXXXXXXXXXXXXXXXXXX
    fragment 2 ———XXXXXXXXXXXX————-
    fragment 3 ———————XXXXXXXXXXXXX
    fragment 4 —-XXXXXXXXXXXXXXXXXX————
    sequence 3 XXXXXXXXXXXXXXXXXXXXXXXXXXXXXXXXXX
    sequence 4 XXXXXXXXXXXXXXXXXXXXXXXXXXXXXXXXXX
    sequence 5 XXXXXXXXXXXXXXXXXXXXXXXXXXXXXXXXXX
    fragment 5 ———————–XXXXXXXXXXX


And from these trees we want to place each fragment relative to (1) the full length sequences and (2) to each other if possible. We also, of course, want branch lengths to reflect some sort of amount of evolution and thus do not just want a cladogram.

So what Steven decided to do in the end was create a method that took all of the AMPHORA markers and concatenated them together into a single mega alignment and then built a reference tree of this mega alignment from available genomes.  Then he searched for matches to any of these genes in metagenomic data and built a tree for each sequence that placed it relative to the reference data.  
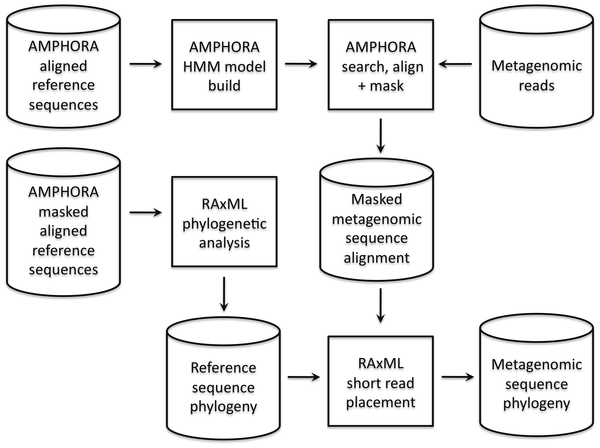
Figure 1. Conceptual overview of approach to infer phylogenetic relationships among sequences from metagenomic data sets.
This pipeline allowed him to place many sequences from metagenomic samples onto a single tree such as this one:

Phylogenetic tree linking metagenomic sequences from 31 gene
families along an oceanic depth gradient at the HOT ALOHA site 

And from that he could calculate PD for metagenomic samples.  We then used the PD calculations to comparate and contrast PD with other information in particular from the HOT ALOHA metagenomic data set of Ed Delong, Steve Karl and others.

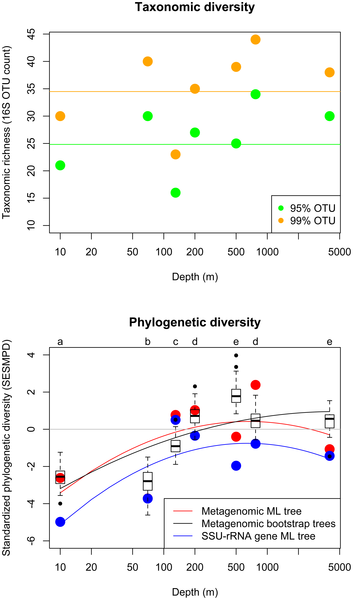
Figure 3. Taxonomic diversity and standardized
phylogenetic diversity versus depth in environmental
samples along an oceanic depth gradient at the HOT ALOHA site.

For more detail on what we did from there on – read the paper.  It is open access so all can see it / download it / play with it / whatever.  But rather than blather on and on as usual I thought I would email Steve some questions and then post his answers.  These are below:

Can you provide any background to how this work got started and why you ended up doing it?

This work got started as a collaboration between the Eisen, Green, and Pollard labs as part of the iSEEM project (“Integrating Statistical Evolutionary & Ecological Approaches to Metagenomics”), which was funded by the Moore Foundation to figure out ways to address ecological and evolutionary questions using metagenomic data. I had a background in using phylogenetic and evolutionary information to understand ecological communities, and one of the things I wanted to do at iSEEM was to try to think about ways that we could apply methods from ecophylogenetics or phylogenetic community ecology to metagenomic data sets. In conversations among the co-authors, we realized that if we could build phylogenetic hypotheses for organisms based on metagenomic data, we could apply a huge body of ecological and evolutionary theory and use these data sets to improve our understanding of microbial communities and their dynamics.

2. How did you end up working on microbes with your background in larger organisms?

The transition from working on macro-organisms to working on microbes actually wasn’t that big of a leap, since my research has generally been question driven rather than study-system or study-organism driven. My previous research involved using phylogenetic information to better understand community assembly in plants and animals. The increasing availability of phylogenetic information for entire communities of plants and animals drove the development of the field of ‘ecophylogenetics’, and it always seeemed to me that microbes would be the ideal system for this type of approach due to the greater availability of sequence data and phylogenetic information for microbes. Also, the development of high-throughput  sequencing methods meant that the size of microbial community data sets would quickly become really, really large… the prospect of working on data sets with hundreds of millions of observations was really exciting. As my first postdoc was wrapping up, I collaborated on a study looking at phylogenetic diversity of the rhizobacterial symbionts of plant roots that got me interested in microbial ecology. Right around that time I came across the opportunity to work on the iSEEM project, so it seemed like the perfect opportunity to try a new study system.

Having studied the community ecology of both micro- and macro-organisms, I find it interesting that the fields of microbial and non-microbial phylogenetic community ecology have been fairly insulated from one another until recently. For example, the two fields independently developed phylogenetic approaches to community ecology, each field having its own set of favored statistical methods and software packages, with almost no cross-citation, despite addressing very similar questions. In microbiology the emphasis on phylogenetic diversity measures seems to have been driven by the empirical difficulty of defining microbial ‘species’ and other taxonomic units that macro-organismal ecologists are comfortable with, as well as the availability of phylogenetic and sequence data for microbes. Conversely, for macroorganisms the field of ecophylogenetics was driven by a desire to apply a large body of theory on the links between ecological and evolutionary dynamics to empirical data sets, but was relatively data poor in terms of phylogenetic information about individual species.

3. What was the biggest challenge in this work?

For me the biggest challenge was convincing myself and others that we could infer anything about organismal phylogenies from metagenomic data.  People had built phylogenies for individual genes from metagenomic data sets, but there was a lot of skepticism about how and whether it would be possible to infer a phylogeny for multiple genes given the short, non-overlapping nature of metagenomic sequences. A post on your blog provided a lot of useful feedback. In the end this challenge was overcome both through the availability of software packages for placement of short sequences onto reference phylogenies, as well as simulation and bootstrap analyses to make sure that the results we were finding were robust.

4. Any additional things left out of the paper that you would like to mention here? Other acknowledgements?  Annoyances?

There were a number of people involved in the iSEEM project, including Samantha Risenfeld and Aaron Darling, who did simulations that were very helpful in figuring out when and whether we could make inferences about phylogenetic relationships among metagenomic reads.

Our paper makes use of a large number of open-source software packages and I’d like to thank the people who made their code available for re-use in this way. In particular the short sequence placement methods implemented in packages like RAxML and pplacer made this study possible.

5. What (in general) are your current and future plans?

Right now I’m working at the Biology & the Built Environment Center on a number of projects studying the phylogenetic and functional diversity of microbes in indoor environments, trying to understand the interaction between architectural design and microbial diversity indoors, and the role indoor microbes play in human health and well being. I am still interseted in plant biology, and I have an ongoing project looking at the diversity and function of microbial communities on plant leaves (the ‘phyllosphere’) in tropical and temperate forests.

Kembel, S., Eisen, J., Pollard, K., & Green, J. (2011). The Phylogenetic Diversity of Metagenomes PLoS ONE, 6 (8) DOI: 10.1371/journal.pone.0023214

Bad science press release of the week: UC Merced on Circadian clocks in bacteria

Well, mind you, I like UC Merced and I sympathize with press offices and scientists who want publicity. But boy, this press release really got on my nerves: Professor Discovers Mechanism Behind Bacteria’s Biological Clock | University of California, Merced

Among the things I do not like in it:
“cyanobacteria, which is believed to be the oldest organism on Earth”
cyanobacteria refers to an entire Phylum not an organism and they are not “old” though there may have been cyanobacteria like taxa a long time ago
“All life — from bacteria to plants to humans — have evolved on Earth to anticipate sunrise and sunset”
– umm – cave organisms? deep sea organisms?
“These findings help pave the way for researchers who are studying the circadian rhythms of higher organisms”
– I hate the term “higher organisms” – it is meaningless to me
“Example of the campus’ innovative research toward health-related problems”
– circadian rhythms are really cool – I even worked on them previously – but the studies in cyanobacteria are not really health related – they are basic science
The science in this work might be cool. But I have a hard time getting past this press releases.

An ecosystem in my house? Yes indeed. And with microbes too. #BostonGlobe #microBEnet

Well I am very excited about this article in the Boston Globe today: Ecosystem, sweet ecosystem – The Boston Globe. By Courtney Humphries the article discusses the Sloan Foundation program in the “Indoor Environment” that is focusing on microbial ecology of the built environment. I am, well, really into this area of work and have a grant from the Sloan Foundation in their program to crete something called “microBEnet” which stands for “microbiology of the Built Environment network.” And in case you were wondering, yes, the BE is supposed to be capitalized and the m in microbe is not. My work in microBEnet is focused on Science 2.0 activities to help boost interaction and communication and outreach relating to studies of microbiology of the built environment. Check out the microBEnet site for more detail on that project (more on this in a bit).
Anyway, a little while ago I was interviewed by Courtney Humphries about studies of microbes in the built environment and the conversation seemed to go pretty well. And I kind of forgot about it due to some family things going on in my life. And then yesterday I saw the article. It is quite nice. It starts off with a nice drawing of a house making it look like an ecosystem

and the headline/lead in is really quite perfect “Ecosystem, sweet ecosystem.” is the headline with the subtitle “What if we studies the indoors as an environment all it’s own”.  She goes on to quite Hal Levin (my collaborator on microBEnet), Jessica Green (the head of the BioBE center in Oregon focusing on biology of the built environment), me, Paula Olsiewski (the Program Officer at Sloan in charge of the Indoor Environment program) and Bill Nazaroff from Berkeley, who is also funded by the Sloan Foundation to work in this area.

The article is definitely worth a read.  Only issue really is that I have a feeling people may be distracted by some sort of storm hitting the East Coast right now.  Well, after the storm hits, microbiology of the indoor environment will likely be even more important to pay attention to.

If you want to brush up on studies of microbiology of the built environment check out some of the resources we have made and/or collated at microBEnet including:

Stay tuned for more, from microBEnet, from Sloan funded researchers, and from others studying microbiology of the built environment.  We spend on the order of 90% of our lives in built environments like buildings, cars, trains, etc.  It’s about time we started studying such environments as ecosystems …

Twisted tree of life award #11: National Geographic for emphasizing Five Kingdoms & no Bacteria/Archaea

Well, I really don’t want to complain so much but I guess I am on a roll recently.  And an email from Will Trimble pointed me to a news story that I cannot resist dissing a little bit.  The story is from National Geographic (86 Percent of Earth’s Species Still Unknown?) and discusses the recent paper on number of species on Earth that I critiqued a bit in my last blog post: Bacteria & archaea don’t get no respect from interesting but flawed #PLoSBio paper on # of species on the planet

The National Geographic article alas does not discuss the problems with the paper in terms of microbes (though Carl Zimmer’s NY Times article How Many Species on Earth? It’s Tricky does as does a Google Plus post from Ed Yong. But that is not what I am here to moan about.  I am here to give out an award – a Twisted Tree of Life Award.  You see, I give this out when people who should generally know better do something bad relating to evolution.  And National Geographic (or, well, Traci Watson, the author) did in this article.  The complaint I have is the emphasis on the Five Kingdoms.  She writes.

Scientists lump similar species together into a broader grouping called a genus, similar genera into a still broader category called a family, and so on, all the way up to a supercategory called a kingdom….. There are five kingdoms: animals, plants, fungi, chromists—including one-celled plants such as diatoms—and protozoa, or one-celled organisms.

First of all, except for some of the most old school of old school folks, biology has moved way way beyond the five kingdoms.  In fact, I gave out an award to Science Friday in 2008 for emphasizing the five kingdoms: The Tree of Life: Twisted Tree of Life Award #2: Science Friday on the Five Kingdoms.  But I guess the author/editors did not see that.  Basically what I said there was that the modern view is much more complex than the five kingdoms with things like “Domains” (i.e., bacteria, archaea and eukaryotes) as the three main lineages of life.  And within eukaryotes there are many more subgroups than the ones the five kingdoms system recognized.

Perhaps even weirder though, the five kingdoms they list in the National Geographic article are not the same five kingdoms from Whittaker in 1969 which is the traditional source of the five kingdom system.  Whittaker had Monera (i.e., organisms without nuclei aka prokaryotes), Protists (single celled eukaryotes not in the other groups), Plants, Fungi and Animals.

Not quite sure where they came up with the five listed in the National Geographic article.  Most likely from Cavalier-Smith who has been pushing the Chromists.

Figure 1. From Biol Lett. 2010 June 23; 6(3): 342–345.

But not sure what happened to the Monera.  Or, another way of putting this is that they appear to think that bacteria and archaea are not organisms.

So even if you still follow the sort-of five kingdom system, or Cavalier-Smith’s six kingdom system – the National Geographic five kingdoms leave out all bacteria and archaea.  And I would say most if evolutionary biologists these days do not use either the five kingdom or six kingdom system and instead use something much more elaborate, with many more eukaryotic groups and multiple groups of non-eukaryotes.

So – for leaving out bacteria and archaea entirely and for pushing the 5/6 kingdom system that seems, well, out of date, I am giving National Geographic and Traci Watson my coveted Twisted Tree of Life Award.

Previous winners include

Bacteria & archaea don’t get no respect from interesting but flawed #PLoSBio paper on # of species on the planet

ResearchBlogging.org

Uggh. Double uggh. No no. My first blog quadruple uggh. There is an interesting new paper in PLoS Biology published today. Entitled “How many Species Are There on Earth and in the Ocean?” PLoS Biol 9(8): e1001127 – it is by Camilo Mora, Derek Tittensor, Sina Adl, Alastair Simpson and Boris Worm. It is accompanied by a commentary by none other than Robert May, one of the greatest Ecologists of all time: PLoS Biology: Why Worry about How Many Species and Their Loss?

I note – I found out about this paper from Carl Zimmer who asked me if I had any comments.  Boy did I.  And Zimmer has a New York Times article today discussing the paper: How Many Species on Earth? It’s Tricky.  Here are my thoughts that I wrote down without seeing Carl’s article, which I will look at in a minute.

The new paper takes a novel approach to estimating the number of species. I would summarize it but May does a pretty good job:
“Mora et al. [4] offer an interesting new approach to estimating the total number of distinct eukaryotic species alive on earth today. They begin with an excellent survey of the wide variety of previous estimates, which give a range of different numbers in the broad interval 3 to 100 million species”
….
“Mora et al.’s imaginative new approach begins by looking at the hierarchy of taxonomic categories, from the details of species and genera, through orders and classes, to phyla and kingdoms. They documented the fact that for eukaryotes, the higher taxonomic categories are “much more completely described than lower levels”, which in retrospect is perhaps not surprising. They also show that, within well-known taxonomic groups, the relative numbers of species assigned to phylum, class, order, family, genus, and species follow consistent patterns. If one assumes these predictable patterns also hold for less well-studied groups, the more secure information about phyla and class can be used to estimate the total number of distinct species within a given group.”
The approach is novel and shows what appears to be some promise and robustness for certain multicellular eukaryotes. For example, analysis of animals shows a reasonable leveling off for many taxonomic levels:

Figure 1. Predicting the global number of species in Animalia from their higher taxonomy. (A–F) The temporal accumulation of taxa (black lines) and the frequency of the multimodel fits to all starting years selected (graded colors). The horizontal dashed lines indicate the consensus asymptotic number of taxa, and the horizontal grey area its consensus standard error. (G) Relationship between the consensus asymptotic number of higher taxa and the numerical hierarchy of each taxonomic rank. Black circles represent the consensus asymptotes, green circles the catalogued number of taxa, and the box at the species level indicates the 95% confidence interval around the predicted number of species (see Materials and Methods).
From Mora C, Tittensor DP, Adl S, Simpson AGB, Worm B (2011) How Many Species Are There on Earth and in the Ocean? PLoS Biol 9(8): e1001127. doi:10.1371/journal.pbio.1001127

They also do a decent job of testing their use of higher taxon discovery to estimate number of species.  Figure 2 shows this pretty well.

Figure 2. Validating the higher taxon approach. We compared the number of species estimated from the higher taxon approach implemented here to the known number of species in relatively well-studied taxonomic groups as derived from published sources [37]. We also used estimations from multimodel averaging from species accumulation curves for taxa with near-complete inventories. Vertical lines indicate the range of variation in the number of species from different sources. The dotted line indicates the 1∶1 ratio. Note that published species numbers (y-axis values) are mostly derived from expert approximations for well-known groups; hence there is a possibility that those estimates are subject to biases arising from synonyms.

So all seems hunky dory and pretty interesting.  That is, until we get to the bacteria and archaea.  For example, check out Table 2:

Table 2. Currently catalogued and predicted total number of species on Earth and in the ocean.

Their approach leads to an estimate of 455 ± 160 Archaea on Earth and 1 in the ocean.  Yes, one in the ocean.  Amazing.  Completely silly too.  Bacteria are a little better.  An estimate of 9,680 ± 3,470 on Earth and 1,,320 ±436 in the oceans.  Still completely silly.

Now the authors do admit to some challenges with bacteria and archaea. For example:

We also applied the approach to prokaryotes; unfortunately, the steady pace of description of taxa at all taxonomic ranks precluded the calculation of asymptotes for higher taxa (Figure S1). Thus, we used raw numbers of higher taxa (rather than asymptotic estimates) for prokaryotes, and as such our estimates represent only lower bounds on the diversity in this group. Our approach predicted a lower bound of ~10,100 species of prokaryotes, of which ~1,320 are marine. It is important to note that for prokaryotes, the species concept tolerates a much higher degree of genetic dissimilarity than in most eukaryotes [26],[27]; additionally, due to horizontal gene transfers among phylogenetic clades, species take longer to isolate in prokaryotes than in eukaryotes, and thus the former species are much older than the latter [26],[27]; as a result the number of described species of prokaryotes is small (only ~10,000 species are currently accepted).

But this is not remotely good enough from my point of view. Their estimates of ~ 10,000 or so bacteria and archaea on the planet are so completely out of touch in my opinion that this calls into question the validity of their method for bacteria and archaea at all. 
Now you may ask – why do I think this is out of touch. Well because reasonable estimates are more on the order or millions or hundreds of millions, not tens of thousands. To help people feel their way through the literature on this I have created a Mendeley group where I am posting some references worth checking out.

I think it is definitely worth looking at those papers.  But just for the record, some quotes might be useful.  For example, Dan Dykhuizen writes

we estimate that there are about 20,000 common species and 500,000 rare species in a small quantity of soil or about a half million species.

And Curtis et al write:

We are also able to speculate about diversity at a larger scale, thus the entire bacterial diversity of the sea may be unlikely to exceed 2 × 10^6, while a ton of soil could contain 4 × 10^6 different taxa.

Are their estimates perfect?  No surely not.  But I think without a doubt the number of bacterial and archaeal species on the planet is in the range of millions upon millions upon millions.  10,000 is clearly not even close.  Sure, we do not all agree on what a bacterial or archaeal species is.  But with just about ANY definition I have heard, I think we would still count millions.

Given how horribly horribly off their estimates are for bacteria and archaea, I think it would have been better to be more explicit in admitting that their method probably simply does not work for such taxa right now.  Instead, they took the approach of saying this is a “lower bound”.  Sure.  That is one way of dealing with this.  But that is like saying “Dinosaurs lived at least 500 years ago” or “There are at least 10 people living in New York City” or “Hiking the Appalachian Trail will take at least two days.”  Lower bounds are only useful when they provide some new insight.  This lower bound did not provide any.
Mind you, I like the paper.  The parts on eukaryotes seem quite novel and useful.  But the parts of bacteria and archaea are painful.  Really really painful.
Mora, C., Tittensor, D., Adl, S., Simpson, A., & Worm, B. (2011). How Many Species Are There on Earth and in the Ocean? PLoS Biology, 9 (8) DOI: 10.1371/journal.pbio.1001127

So psyched. Got my new artwork from @artologica …. Even better than I imagined from web pics

 Art by Michelle Banks.  Check out her store

Get to know Jack & the story behind the paper by @gilbertjacka "Defining seasonal marine microbial community dynamics"

ResearchBlogging.org A few days ago I became aware of the publication of a cool new paper: “Defining seasonal marine microbial community dynamics” by Jack A. Gilbert, Joshua A Steele, J Gregory Caporaso, Lars Steinbrück, Jens Reeder, Ben Temperton, Susan Huse, Alice C McHardy, Rob Knight, Ian Joint, Paul Somerfield, Jed A Fuhrman and Dawn Field.  The paper was published in the ISME Journal and is freely available using the ISME Open option. If you want to know more about Jack (in case you don’t know Jack, or don’t know jack about Jack) check out some of his rantings material on the web like his Google Scholar page, and his twitter feed, his LinkedIn page, his U. Chicago page. But rather than tell you about Jack or the paper, I thought I would send some questions to the first author, Jack Gilbert and see if I could get some of the “story behind the paper” out of him.  Since Jack likes to talk (and email and do things on the web), I figured it was highly likely I could get some good answers.  And indeed I was right. Here are his answers to my quickly written up questions (been out of the office due to family illness)


1. Can you provide some detail about the history of the project … How did it start ? What were the original plans ? (not this much sequencing I am sure)

The Western English Channel has been studied for over 100 years, and is in fact it is the longest studied marine site in the world. It is the home, essentially of the Marine Biological Association, and has a long history. The idea to start contextualizing the abundant metadata (www.westernchannelobservatory.org) was started in 2003 by Ian Joint, a senior researcher at Plymouth Marine Laboratory (www.pml.ac.uk), who saw the benefit of collecting microbial life on filters and storing these at -80C. It was his vision to create and maintain this collection that enabled us to go back through this frozen time series and explore microbial life. I started working for PML in 2005, and basically was charged with trying to identify a potential technique to characterize the microbial life in these samples. initially we got funding through the International Census of Marine Life to performed 16S rDNA V6 pyrosequencing on 12 samples. We chose 2007 as the first year, almost arbitrarily, and published that work in Environmental Microbiology in 2009 (http://onlinelibrary.wiley.com/doi/10.1111/j.1462-2920.2009.02017.x/abstract). However, we had already decided to go ahead, and with help from Dawn Field (Center for Ecology and Hydrology, UK) we were able to secure funding to pyrosequence 60 further amplicon samples, essentially we did 2003-2008. We deposited all these in the ICoMM dataset (link below) and it quickly became the largest study in the series. This was also a gold standard study for the Genomic Standards Consortium’s MIMARKS checklist (http://www.nature.com/nbt/journal/v29/n5/full/nbt.1823.html). We published the first analysis of these data in Nature Preceedings in 2010 (http://precedings.nature.com/documents/4406/version/1). We continued to characterize the microbial communities of the L4 sampling site in the Western English Channel by employing Metagenomic and Metatranscriptomic along side more 16S rRNA V6 pyroseqeuncing across diel and seasonal time scales throughout 2008 (the final year of the 6 year time series. This study was published in PLoS ONE also in 2010 (http://www.plosone.org/article/info%3Adoi%2F10.1371%2Fjournal.pone.0015545). This study also included our first analysis fo archaeal diversity in the English Channel, which was also funded through the ICoMM initiative. We owe a lot to Mitch Sogin’s group for the first attempts at data analysis for the 16S rDNA profiles. We had a lot of difficulty getting the message right for the 6-year paper that was recently published in ISME J. Basically it was an issue of sequencing data as Natural History, we were generating data catalogs, and not doing enough to characterize the ecology interactions that occurred there.  So we reached out to the community, and found research groups who could help us plug that gap. Those involved Rob Knight’s team, Alice McHardy’s team, and Jed Fuhrman’s team. We worked a lot of improving this paper, and had some valuable help from a wide selection of other researchers, including Steven Giovannoni, Doug Barlett, among many others.

The publication of this study however, is just the start. 

2. Who collected the samples? Any good field stories?

Samples were all collected by the fantastic boat staff at Plymouth Marine Laboratory, who routinely go out every Monday morning to collect water and specific samples for the whole laboratory. They were the life blood of that organization. One specific I always like to relate is that during the 2008 sampling season which generated samples for both the new ISME J paper (http://www.nature.com/ismej/journal/vaop/ncurrent/full/ismej2011107a.html) and the 2010 PLoS ONE paper (http://www.plosone.org/article/info%3Adoi%2F10.1371%2Fjournal.pone.0015545), we wanted to get diel sampling effort during the winter spring and summer. Unfortunately the only time I could convince my group to go out sampling for 24 hours was during the summer….some times science is limited by enthusiasm ;-). Also, the site is outside the Plymouth Sea Wall – which I think is still the largest concrete structure in the UK and was built in the 19th century, so taking people out to see the site (for what it was worth ;-)) meant taking them into usually very choppy water….which made people quite sick sometimes.In May 2009, J. Craig Venter and his crew came through to start the European leg of this Global Ocean Sampling expedition at L4, specificallly the Western English Channel. Together, our team at PML on our fishing boat, Plymouth Quest, and his team on-board the 100ft yacht, Sorcerer II sampled L4 and E1 (another monitoring site) in the Western English Channel. Excitingly these data form the first part of the attempt to start cataloguing the viral and Eukaryotic metagenomic and metatranscriptomic analysis of these communities. This analysis is being also further characterized using meta-metabolomics run by Carole Llewelyn at PML and Mark Viant at University of Birmingham. Increasing the multi’omic nature of these data.

3. Can you give some web links for data, people involved , etc?

  • People on the paper – not an exhaustive list of those involved….this is a huge community effort.

4. What else do you want people to know ?

We have recently started to model the English Channel from both a taxonomic and functional perspective. I have attached a presentation that has cool gifs that demonstrate this, people can email me and request the gifs if necessary. These are generated by Peter Larsen at Argonne National Laboratory.This modelling is being driven by two new tools:(1) Predicted Relative Metabolic Turnover, which uses fucntional annotations from metagenomes to create predicted metabolomes, which enable us to accurate predict the turnover (relative consumption or production) of more than 1000 metabolites in the English Channel (http://www.microbialinformaticsj.com/content/1/1/4).(2) Microbial Assemblage Prediction, which enables the prediction of the relative abundance of every bacterial taxon at any given location and time, the predictions are driven by in situ or remotely modeled environmental parameter data. We used satellite data to produce the figures above, truely BUGS FROM SPAAAAACCCCCEEEE…..This is the new paradigm – creating information and predictive models from data – no longer will metagenomics be descriptive Natural History – it is now becoming ECOLOGY. These tools will form the corner stone the Earth Microbiome Project’s (www.earthmicrobiome.org) data analytical initiative to create predictive models of microbial taxonomic community abundance structure and functional capability defined as the ability of a community to turnover metabolites.

Note – as a bit of a side story – I am disappointed in the ISME Journals “Open” option for publishing which, though it uses a creative commons license, it is a pretty narrow one that says, for example “You may not alter, transform, or build upon this work.” That is pretty limiting.  It means, for example, that the text cannot be reworded into a database of full text of papers where one uses intelligent language processing methods to play with the text.  It also means technically I probably cannot take the figures and modify them in any way to, for example, make an interesting movie using them.  Imagine if Genbank worked this way.  Imagine if you could only look at sequences but could not make alignments of them.  It is, well, not very open. So really this should be called the ISME “No charge” option or something like that since this is not “open access” to me – I think “open access” should really be reserved for material that is free of charge and free of most/all use restrictions (I prefer  the broader version of the “open access” definition described by Peter Suber.).  Sure – the fact that ISME makes some stuff available at no charge is nice.  And that they use CC licenses is good too since these are very straightforward to interpret compared to other licenses.  But their use of the no derivatives option seems silly. Anyway – nice paper.  And I hope some of the story behind the paper is useful to people.

Reference:

Gilbert JA, Steele JA, Caporaso JG, Steinbrück L, Reeder J, Temperton B, Huse S, McHardy AC, Knight R, Joint I, Somerfield P, Fuhrman JA, & Field D (2011). Defining seasonal marine microbial community dynamics. The ISME journal PMID: 21850055

Some recent posts (of mine) from http:microbe.net on microbes of the built environment that may be of interest

Just thought I would post a little list here of some recent blog posts I have made at a relatively new blog for my microBEnet project.  I may cross post occasionally but for now just going to post a list:

Would love it if people checked out the blog: http://www.microbe.net/microbenet-blog/ and the web site http://www.microbe.net/ and let me know what you think.