I am phylogeny obsessed but this is too much to me: phylogeny of cancer subtypes

Just because you have data that could be plugged into a phylogenetic analysis does not mean it makes sense to do so. Case in point – the following paper:

A Differentiation-Based Phylogeny of Cancer Subtypes by Riester M, Stephan-Otto Attolini C, Downey RJ, Singer S, Michor F.

In this paper the authors take gene expression data from various cancer samples/cell lines and then they build phylogenetic trees from the data.  See example below:

Figure 2. A phylogeny of acute myeloid leukemia (AML) subtypes. According to the French-American-British (FAB) classification, AML samples are classified into seven different types according to their level of differentiation (see Table 1). Expression data from 362 AML patients and 7 Myelodysplastic Syndrome (MDS-AML) patients is used to construct a phylogeny of these leukemias. We include expression data of human embryonic stem cells (hESCs), CD34+ cells from bone marrow (CD34 BM) and peripheral blood (CD34 PB), and mononuclear cells from bone marrow (BM) and peripheral blood (PB). The differentiation pathway from hESCs to mononuclear cells from peripheral blood is represented in purple, and the common ancestors of subtypes are shown as pink dots. The bootstrap values of branches are indicated by boxed numbers, representing the percentage of bootstrapping trees containing this branch. The ranking of AML subtypes identified by the phylogenetic algorithm corresponds with the differentiation status indicated by the FAB classification. The M6 subtype, represented by only 10 samples in our dataset, has the least stable branch, leading to lower bootstrap values for those branches where it can alternatively be located.

The pictures are pretty.  They make some sense biologically.  The paper has some very interesting parts and I do not want to suggest that the paper is not useful.  But it makes no sense to me to use a phylogenetic approach to analyze this data.  Phylogenetic methods are about reconstructing history of evolutionary lineages.  They should not be doing that here as far as I can tell since the cancers are from different people with different histories and what they make be looking at is convergent / developmental similarities in the cancer samples.  But they are not looking at history per se.  And thus it is not appropriate to use algorithms that use phylogenetic methods:

It just makes no sense to me to use a phylogenetic method instead of some sort of clustering method in the step where it says “construct tree” in their flow diagram.  Sure phylogenetic methods can make nice pictures.  But they should only be used when the underlying data has a history that is reflected in the model/assumptions of the phylogenetic method.  I could, for example build a phylogeny of cities based on various metrics.  But would that make sense?  Most likely not.  Don’t get confused by the fact that similar things group together in the same part of a phylogenetic tree to thinking that that means that a phylogenetic model is right for your data.

I may be obsessed with phylogeny but that obsession applies to applying phylogenetic methods to data with histories that are approximated by the methods being used …  and this paper seems to not be doing that …

Hat tip to Eric Lowe, an undergrad in my lab for showing me this paper.

I note – this does not mean that phylogenetic methods cannot be applied to cancer studies.  Case in point – this paper:

Estimation of rearrangement phylogeny for cancer genomes by Greenman CD, Pleasance ED, Newman S, Yang F, Fu B, Nik-Zainal S, Jones D, Lau KW, Carter N, Edwards PA, Futreal PA, Stratton MR, Campbell PJ.

In this paper the authors focus on mutations in cancer cells and they use phylogenetic methods to determine the order in which genomic changes happen in these cancer cells.  This seems to be an excellent use of phylogenetic / phylogenomic methods.

So – lesson of the day – phylogenetic methods should be used on data with a phylogenetic history.  Not so complicated.  But pretty important.

Evolution pumpkins – from Darwin to Woese

OK I know I am a geek, but I do think these came out pretty well …

“I think” in honor of Darwin

Woese Tree of Life

The story behind Pseudomonas syringae comparative genomics / pathogenicity paper; guest post by David Baltrus (@surt_lab)

More fun from the community.  Today I am very happy to have another guest post in my “Story behind the paper” series.  This one comes to us from David Baltrus, an Assistant Professor at University of Arizona.  For more on David see his lab page here and his twitter feed here.  David has a very nice post here about a paper on the “Dynamic evolution of pathogenicity revealed by sequencing and comparative genomics of 19 Pseudomonas syringae isolates” which was published in PLoS Pathogens in July.  There is some fun/interesting stuff in the paper, including analysis of the “core” and “pan” genome of this species.  Anyway – David saw my request for posts and I am very happy that he responded.  Without further ado – here is his story (I note – I added a few links and Italics but otherwise he wrote the whole thing …).
—————————————
I first want to than Jonathan for giving me this opportunity. I am a big fan of “behind the science” stories, a habit I fed in grad school by reading every Perspectives (from the journal Genetics) article that I could get a hold of. Science can be rough, but I remember finding solace in stories about the false starts and triumphs of other researchers and how randomness and luck manage to figure into any discovery. If anything I hope to use this space to document this as it is fresh in my mind so that (inevitably) when the bad science days roll around I can have something to look back on. In the very least, I’m looking forward to mining this space in the future for quotes to prove just how little I truly understood about my research topics in 2011. It took a village to get this paper published, so apologies in advance to those that I fail to mention. Also want to mention this upfront, Marc Nishimura is my co-author and had a hand in every single aspect of this paper.
Joining the Dangl Lab
This project really started way back in 2006, when I interviewed for a postdoc with Jeff Dangl at UNC Chapel Hill. In grad school I had focused on understanding microbial evolution and genetics but I figured that the best use of my postdoc would be to learn and understand genomics and bioinformatics. I was just about to finish up my PhD and was lucky enough to have some choices when it came around to choosing what to do next. I actually had no clue about Dangl’s research until stumbling across one of his papers in Genetics, which gave me the impression that he was interested in bringing an evolutionary approach to studies of the plant pathogen Pseudomonas syringae. I was interested in plant pathogens because, while I wanted to study host/pathogen evolution, my grad school projects on Helicobacter pylori showed me just how much fun it is dealing with the bureaucracy of handling human pathogens. There is extensive overlap in the mechanisms of pathogenesis between plant and human pathogens, but no one really cares how many Arabidopsis plants you infect or if you dispose of them humanely (so long as the transgenes remain out of nature!). By the time I interviewed with Jeff I was leaning towards joining a different lab, but the visit to Chapel Hill went very well and by the end I was primed for Dangl’s sales pitch. This went something along the lines of “look, you can go join another lab and do excellent work that would be the same kinds of things that you did in grad school…or you can come here and be challenged by jumping into the unknown”. How can you turn that down? Jeff sold me on continuing a project started by Jeff Chang (now a PI at Oregon State), on categorizing the diversity of virulence proteins (type III effector proteins to be exact) that were translocated into hosts by the plant pathogen Pseudomonas syringae. Type III effectors are one of the main determinants of virulence in numerous gram negative plant and animal pathogens and are translocated into host cells to ultimately disrupt immune functions (I’m simplifying a lot here). Chang had already created genomic libraries and had screened through random genomic fragments of numerous P. syringae genomes to identify all of the type III effectors within 8 or so phylogenetically diverse strains. The hope was that they would find a bunch of new effectors by screening strains from different hosts. Although this method worked well for IDing potential effectors, I was under the impression that it was going to be difficult to place and verify these effectors without more genomic information. I was therefore brought in to figure out a way to sequence numerous P. syringae genomes without burning through a Scrooge McDuckian money bin worth of grant money. We had a thought that some type of grand pattern would emerge after pooling all this data but really we were taking a shot in the dark.

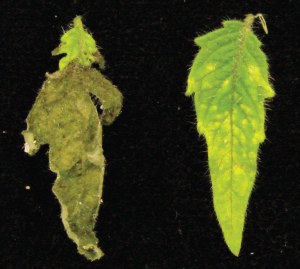
Tomato leaves after 10 days infection by the tomato pathogen P.syringae DC3000 (left) as well as a less virulent strain (right). Disease symptoms are dependent on a type III secretion system.
Moments of Randomness that Shape Science
When I actually started the postdoc, next generation sequencing technologies were just beginning to take off. It was becoming routine to use 454 sequencing to generate bacterial genome sequences, although Sanger sequencing was still necessary to close these genomes. Dangl had it in his mind that there had to be a way to capitalize on the developing Solexa (later Illumina) technology in order to sequence P. syringae genomes. There were a couple of strokes of luck here that conspired to make this project completely worthwhile. I arrived at UNC about a year before the UNC Genome Analysis core facility came online. Sequencing runs during the early years of this core facility were subsidized by UNC, so we were able to sequence many Illumina libraries very cheaply. This gave us the opportunity to play around with sequencing options at low cost, so we could explore parameter space and find the best sequencing strategy. This also meant that I was able to learn the ins and outs of making libraries at the same time as those working in the core facility (Piotr Mieczkowski was a tremendous resource). Secondly, I started this postdoc without knowing a lick of UNIX or perl and knew that I was going to have to learn these if I had any hope of assembling and analyzing genomes. I was very lucky to have Corbin Jones and his lab 3 floors above me in the same building to help work through my kindergarden level programming skills. Corbin was really instrumental to all of these projects as well as in keeping me sane and I doubt that these projects would have turned out anywhere near as well without him. Lastly, plant pathogens in general, and P. syringae in particular, were poised to greatly benefit from next generation sequencing in 2006. While there was ample funding to completely sequence (close) genomes for numerous human pathogens, lower funding opportunities for plant pathogens meant that we were forced to be more creative if we were going to pull of sequencing a variety of P.syringae strains. This pushed us into trying a NGS approach in the first place. I suspect that it’s no coincidence that, independently of our group, the NGS assembler Velvet was first utilized for assembling P.syringae isolates.
The Frustrations of Library Making
Through a collaboration with Elaine Mardis’s group at Washington University St. Louis, we got some initial data back that suggested it would be difficult to make sense of bacterial genomes at that time using only Illumina (the paired end kits weren’t released until later). There simply wasn’t good enough coverage of the genome to create quality assemblies with the assemblers available at this time (SSAKE and VCAKE, our own (really Will Jeck’s) take on SSAKE). Therefore we decided to try a hybrid approach, combining low coverage 454 runs (initially separate GS Flex runs with regular reads and paired ends, and later one run with long paired ends) with Illumina reads to fill in the gaps and leveraging this data to correct for any biases inherent in the different sequencing technologies. Since there was no core facility at UNC when I started making libraries, I had to travel around in order to find the necessary equipment. The closest place that I could find a machine to precisely shear DNA was Fred Dietrich’s lab at Duke. More than a handful of mornings were spent riding a TTA bus from UNC to Duke, with a cooler full of genomic DNA on dry ice (most times having to explain to the bus drivers how I wasn’t hauling anything dangerous), spending a couple of hours on Fred’s hydroshear, then returning to UNC hoping that everything worked well. There really is no feeling like spending a half a day travelling/shearing only to find out that the genomic DNA ended up the wrong size. We were actually planning to sequence one more strain of P. syringae, and already had Illumina data, but left this one out because we filled two plates of 454 sequencing and didn’t have room for a ninth strain. In the end there were two very closely related strains (P.syringae aptata or P. syringae atrofaciens) left to make libraries for and the aptata genome sheared better on the last trip than atrofaciens. If you’ve ever wondered why researchers pick certain strains to analyze, know that sometimes it just comes down to which strain worked first. Sometimes there were problems even when the DNA was processed correctly. I initially had trouble making the 454 libraries correctly in that, although I would follow the protocol exactly, I would lose the DNA somewhere before the final step. I was able to trace down the problem to using an old (I have no clue when the Dangl lab bought it, but it looked as useable as salmon sperm ever does) bottle of salmon sperm DNA during library prep. There were also a couple of times that I successfully constructed Illumina libraries only to have the sequencing runs dominated by few actual sequences. These problems ultimately stemmed from trying to use homebrew kits (I think) for constructing Illumina libraries. Once these problems were resolved, Josie Reinhardt managed to pull everything together and create a pipeline for hybrid genome assembly and we published our first hybrid genome assembly in Genome Research. At that moment it was a thrill that we could actually assemble a genome for such a low cost. It definitely wasn’t a completely sequenced genome, but it was enough to make calls about the presence or absence of genes.
Waiting for the story to Emerge
There are multiple ways to perform research. We are all taught about how important it is to define testable hypothesis and to set up appropriate experiments to falsify these educated guesses. Lately, thanks to the age of genomics, it has become easier and feasible to accumulate as much genomic data as possible and find stories within that data. We took this approach with the Pseudomonas syringae genome sequences because we knew that there was going to be a wealth of information, and it was just a matter of what to focus on. Starting my postdoc I was optimistic that our sampling scheme would allow us to test questions about how host range evolves within plant pathogens (and conversely, identify the genes that control host range) because the strains we were going to sequence were all isolated from a variety of diseased hosts. My naive viewpoint was that we were going to be able to categorize virulence genes across all these strains, compare suites of virulence genes from strains that were pathogens of different hosts, and voila…we would understand host range evolution. The more I started reading about plant pathology the more I became convinced that this approach was limited. The biggest problem is that, unlike some pathogens, P. syringae can persist in a variety of environments with strains able to survive our flourish or on a variety of hosts. Sure we had strains that were known pathogens of certain host plants, but you can’t just assume that these are the only relevant hosts. Subjective definitions are not your friend when wading into the waters of genomic comparisons.
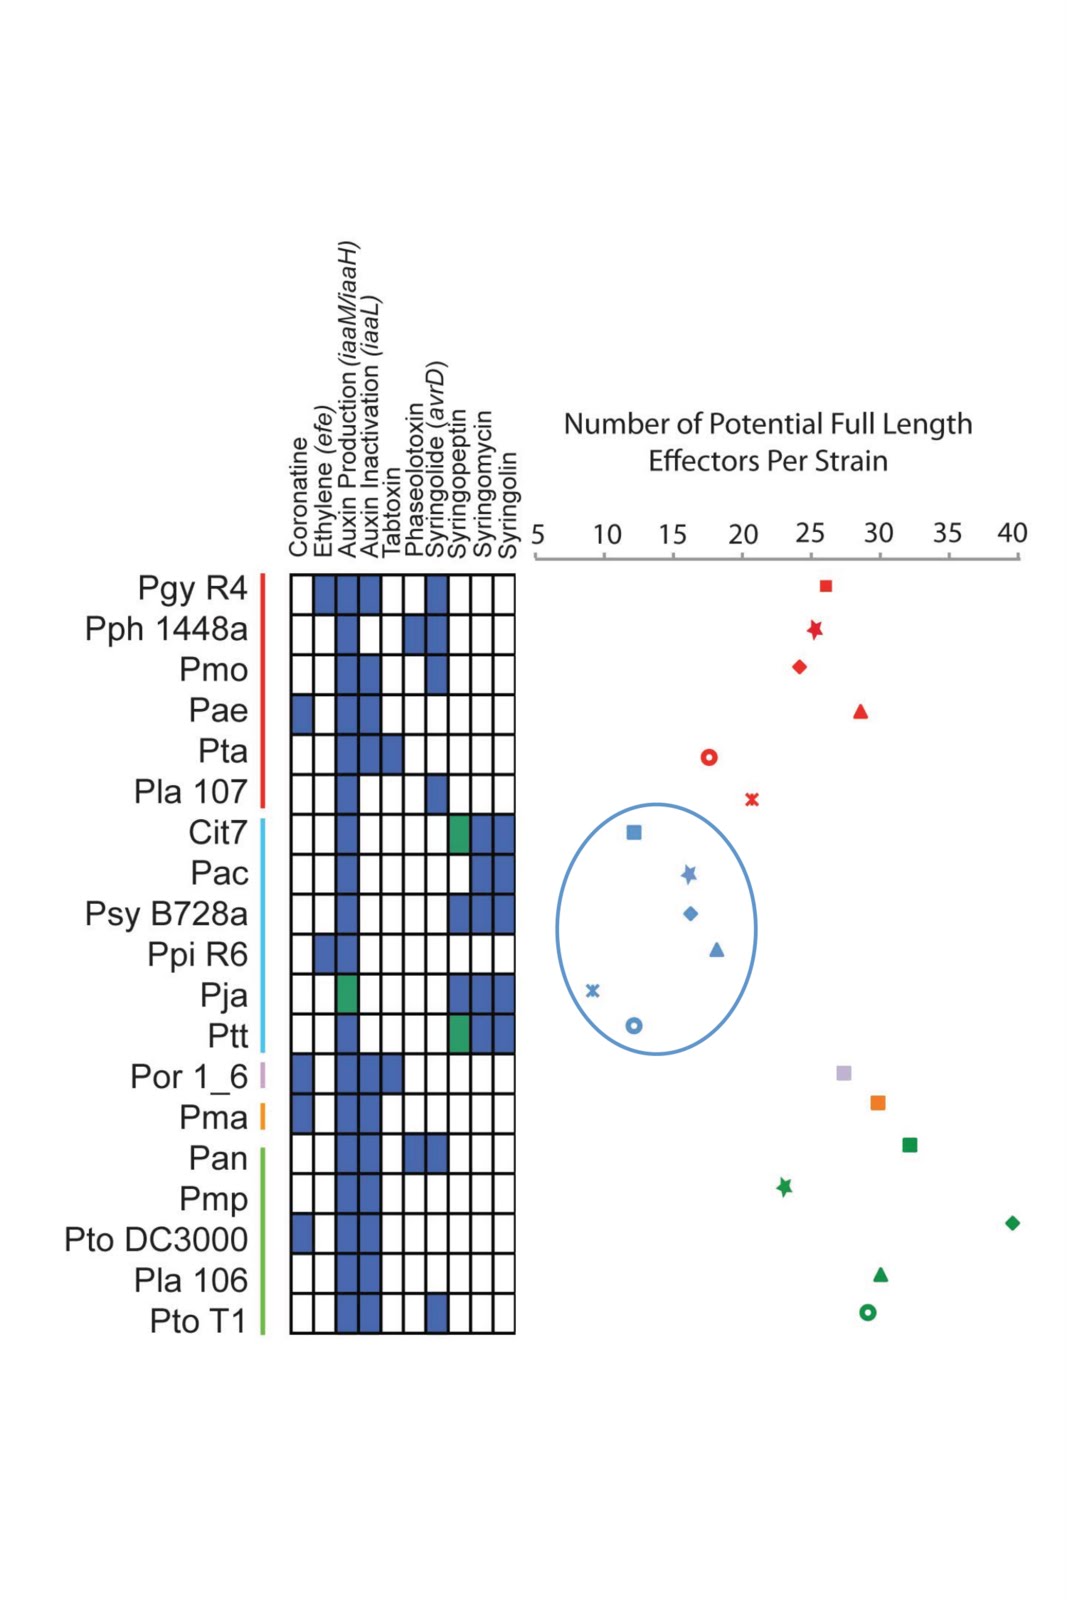
We were quite surprised that, although type III effectors are gained and lost rapidly across P.syringae and our sequenced strains were isolated from diverse hosts, we only managed to identify a handful of new effector families. I should also mention here that Artur Romanchuk came on board and did an extensive amount of work analyzing gene repertoires across strains. A couple of nice stories did ultimately emerge by comparing gene sequences across strains and matching these up with virulence in planta (we are able to show how mutation and recombination altered two different virulence genes across strains), but my two favorite stories from this paper came about from my habit of persistently staring at genome sequences and annotations. As I said above, a major goal of this paper was to categorize the suites of a particular type of virulence gene (type III effectors) across P. syringae. I was staring at gene repertoires across strains when I noticed that two of the strains had very few of these effectors (10 or so) compared to most of the other strains (20-30). When I plotted total numbers of effectors across strains, a phylogenetic pattern arose where genomes from a subset of closely related P. syringae strains possessed lower numbers of effectors. I then got the idea to survey for other classes of virulence genes, and sure enough, strains with the lowest numbers of effectors all shared pathways for the production of well characterized toxin genes (Non ribosomal peptide synthase (NRPS) toxins are secreted out of P. syringae cells and are virulence factors, but are not translocated through the type III secretion system). One exception did arise across this handful of strains (a pea pathogen isolate from pathovar pisi) in that this strain has lost each of these conserved toxin pathways and also contain the highest number of effectors within this phylogenetic group. The relationship between effector number and toxin presence remains a correlation at the present time, but I’m excited to be able to try and figure out what this means in my own lab.
Modified Figure 3 from the paper. Strain names are listed on the left and are color coded for phylogenetic similarity. Blue boxes indicate that the virulence gene/toxin pathway is present, green indicates that the pathway is likely present but sequence was truncated or incomplete, while box indicates absence. I have circled the group II strains, which have the lowest numbers of type III effectors while also having two conserved toxin pathways (syringomycin and syringolin). Note that the Pisi strain (Ppi R6) lacks these toxin pathways.
The other story was a complete stroke of luck. P. syringae genomes are typically 6Mb (6 million base pairs) in size, but one strain that we sequenced (a cucumber pathogen) contained an extra 1Mb of sequence. Moreoever, the two largest assembled contigs from this strain were full of genes that weren’t present in any other P. syringae strain. After some similarity comparisons, I learned that there was a small bit of overlap between each of these contigs and performed PCR to confirm this. Then, as a hunch, I designed primers facing out of each end of the contig and was able to confirm that this extra 1Mb of sequence was circular in conformation and likely separate from the chromosome. I got a bit lucky here because there was a small bit (500bp or so) of sequence that was not assembled with either of these two contigs that closed the circle (a lot more and I wouldn’t have gotten the PCR to work at all). We quickly obtained 3 other closely related strains and were able to show that only a subset of strains contain this extra 1Mb and that it doesn’t appear to be directly involved in virulence on cucumber. So it turns out that a small number (2 so far) of P. syringae strains have acquired and extra 1Mb of DNA, and we don’t quite know what any of these ~700 extra genes do. There are no obvious pathways present aside from additional chromosomal maintenance genes, extra tRNAs in the same ratio as the chromosomal copies, and a couple of secretion systems. So somehow we managed to randomly pick the right strain to capture a very recent event that increased the genome size of this one strain by 15% or so. We’ve made some headway on this megaplasmid story since I started my lab, but I’ll save that for future blog posts.
Modified Figure S12 from the paper. Strains that contain the 1Mb megaplasmid (Pla7512 and Pla107) are slightly less virulent during growth in cucumber than strains lacking the megaplasmid (PlaYM8003, PlaYM7902). This growth defect is also measurable in vitro. In case you are wondering, I used blue and yellow because those were the dolors of my undergrad university, the University of Delaware.Reviewer Critiques
We finally managed to get this manuscript written up by the summer of 2010 and submitted it to PLoS Biology. I figured that (as always) it would take a bit of work to address reviewer’s critiques, but we would nonetheless be able to publish without great difficulty. I was at a conference on P. syringae at Oxford in August of 2010 when I got the reviews back and learned that our paper had gotten rejected. Everyone has stories about reviewer comments and so I’d like to share one of my own favorites thus far. I don’t think it ever gets easier to read reviews when your paper has been rejected, but I was knocked back the main critique of one reviewer:

“I realize that the investigators might not typically work in the field of bacterial genomics, but when looking at divergent strains (as opposed to resequencing to uncover SNPs among strains) it is really necessary to have complete, not draft, genomes. I realize that this might sound like a lot to ask, but if they look at comparisons of, for example, bacterial core and pan-genomes, such as the other paper on this that they cite (and numerous other examples exist), they are based on complete genome sequences. If this group does not wish to come up to the standards applied to even the most conventional bacterial genomics paper, it is their prerogative; however, they should be aware of the expectations of researchers in this field.”

So this reviewer was basically asking us to spend an extra 50k to finish the genomes for these strains before they were scientifically useful. Although I do understand the point, this paper was never about getting things perfect but about demonstrating what is possible with draft genomes. I took the part about working in the field of bacterial genomics a bit personally I have to admit, c’mon that’s harsh, but I got over that feeling by downing a few pints in Oxford with other researchers that (judging by their research and interest in NGS) also failed to grasp the importance of spending time and money to close P. syringae genomes. We managed to rewrite this paper to address most of the other reviewers critiques and finally were able to submit to PLoS Pathogens.

Blast from the past: video of a talk I gave in 2006 #metagenomics

Just re-found this video and posted it to youtube.  It is from a talk I gave in 2006 at the first “International Metagenomics Meeting” in 2006.

I think one may still be able to view videos from the CalIT2/UCSD page here. But I thought it might be better to have this talk on YouTube than at the CalIT site so I posted it … hope they don’t sue me.

Note – I wrote a blog post about the meeting here:
The Tree of Life: Metagenomics 2006

Great paper showing the potential power of comparative and evolutionary genomics in #PLoS Genetics

There is a wonderful paper that has just appeared in PLoS Genetics I want to call people’s attention to: PLoS Genetics: Emergence and Modular Evolution of a Novel Motility Machinery in Bacteria

In the paper, researchers from CNRS and Aix-Marseille in France used some nice comparative and evolutionary genomics analyses along with experimental work to characterize the function and evolution of gliding motility in bacteria.

Their summary of their work:

Motility over solid surfaces (gliding) is an important bacterial mechanism that allows complex social behaviours and pathogenesis. Conflicting models have been suggested to explain this locomotion in the deltaproteobacterium Myxococcus xanthus: propulsion by polymer secretion at the rear of the cells as opposed to energized nano-machines distributed along the cell body. However, in absence of characterized molecular machinery, the exact mechanism of gliding could not be resolved despite several decades of research. In this study, using a combination of experimental and computational approaches, we showed for the first time that the motility machinery is composed of large macromolecular assemblies periodically distributed along the cell envelope. Furthermore, the data suggest that the motility machinery derived from an ancient gene cluster also found in several non-gliding bacterial lineages. Intriguingly, we find that most of the components of the gliding machinery are closely related to a sporulation system, suggesting unsuspected links between these two apparently distinct biological processes. Our findings now pave the way for the first molecular studies of a long mysterious motility mechanism.

Basically, they started with some genetic and functional studies in Myxococcus xanthus.  They analyzed these in the context of the genome sequence (note – I was a co-author on the original genome paper).  And then they did some extensive comparative and evolutionary analysis of these genes, producing some wonderful figures along the way such as:

Figure 2. Taxonomic distribution of the closest homologues of the 14 genes composing the G1, G2, and M1 clusters, and genetic organization of the core complex. (A) For a given gene, the number of homologues in the corresponding genome is indicated by the numbers within arrows. The relationships between the species carrying the different homologues of the genes are indicated by the phylogeny on the left. Based on their taxonomic distribution, the 14 genes can be divided into Group A (grey background) and Group B (white background). (B) In all non Deltaproteobacteria and in Geobacter, the Group B genes clustered in a single genomic region.  doi:10.1371/journal.pgen.1002268.g002  


Based on their analysis they then came up with some hypotheses as to which genes were involved in key parts of gliding motility and what their biochemical functions were and they then went and confirmed this with experiments.  I am not going to go into detail on the functional work they did but you can read their paper for more details.

They wrapped up their paper by proposing an model for the evolutionary history of gliding motility.  I am not sure I buy all components of their model since our sampling of genomes right now is still very poor, but they have a pretty detailed theory captured in part in this figure:

Figure 8. Evolution and structure of the Myxococcus gliding motility machinery. A) Evolutionary scenario describing the emergence and evolution of the gliding motility machinery in M. xanthus. The relationships between organisms carrying close homologues of the 14 genes encoding putative components of the gliding machinery in M. xanthus are represented by the phylogeny. Green and red arrows respectively indicate gene acquisition and gene loss. The number of gene copies that were acquired or lost is indicated within arrows. The purple dotted arrows represent horizontal gene transfer events of one or several components. WGD marks the putative whole genome duplication event that occurred in the ancestor of Myxococcales. For each gene, locus_tag, former (agm/agl/agn) and new (glt and agl) names are provided. The number of complete genomes that contain homologues of glt and agl genes compared to the total number of complete genomes available at the beginning of this study are indicated in brackets. (B) The Myxococcus gliding machinery. The diagram compiles data from this work and published literature. Components were added based on bioinformatic predictions, mutagenesis, interaction and localization studies. Exhaustive information is not available for all proteins and thus the diagram largely is subject to modifications once more data will be available. Known interactions within the complex from experimental evidence are AglR-GltG, AglZ-MglA and interactions within the AglRQS molecular motor [13], [15]. For clarity, the proteins were colour-coded as in the rest of the manuscript 

Anyway – I don’t have much time right now to provide more detail on the paper.  But it is definitely worth checking out.

More on ‘phylogenomics’ – as in functional prediction w/ phylogeny

There is a new paper out: Phylogenetic-based propagation of functional annotations within the Gene Ontology consortium in Briefings in Bioinformatics.

The paper is interesting and presents a new general approach to using phylogeny for functional prediction of uncharacterized genes. I am interested in this for many reasons including that I was one of, if not the first to lay this out as a concept.  In a series of papers from 1995-1998 I outlined how phylogenetic analysis could be used to aid in functional prediction for all the genes that were starting to be sequenced in genome projects without any associated functional studies (at the time, I referred to all these ESTs and other sequences as an “onslaught” – little did I know what was to come).

My first paper on this topic was in 1995: Evolution of the SNF2 family of proteins: subfamilies with distinct sequences and functions.  The abstract is below:

The SNF2 family of proteins includes representatives from a variety of species with roles in cellular processes such as transcriptional regulation (e.g. MOT1, SNF2 and BRM), maintenance of chromosome stability during mitosis (e.g. lodestar) and various aspects of processing of DNA damage, including nucleotide excision repair (e.g. RAD16 and ERCC6), recombinational pathways (e.g. RAD54) and post-replication daughter strand gap repair (e.g. RAD5). This family also includes many proteins with no known function. To better characterize this family of proteins we have used molecular phylogenetic techniques to infer evolutionary relationships among the family members. We have divided the SNF2 family into multiple subfamilies, each of which represents what we propose to be a functionally and evolutionarily distinct group. We have then used the subfamily structure to predict the functions of some of the uncharacterized proteins in the SNF2 family. We discuss possible implications of this evolutionary analysis on the general properties and evolution of the SNF2 family.


I note – I am annoyed that when I went to the Nucleic Acids Research site for my paper I discovered for some bizarre reason they are now trying to charge for access to it even though it is in Pubmed Central and used to be freely available on the NAR site.  WTF?  Is this just an IT issue like the #OpenGate complaints I made for a while about Nature Genome papers.

Anyway – in that paper in 1995 I basically showed that at least for this family, phylogenetic analysis could be used as a tool in making functional predictions by allowing one to better identify orthology relationships and subfamilies within the SNF2 superfamily.  This was novel I think maybe a little bit but others at the time were also looking into using various analyses to identify orthology relationships across genomes.

Shortly thereafter I started working on the concept that one could used the phylogenetic tree more explicitly in making functional predictions and eventually I laid out the concept of treating function as a character states and doing character state reconstruction using a gene tree to then infer functions for uncharacterized genes.  I called this approach “phylogenomics” in a paper in 1997 in Nature Medicine (the editor asked us to give it a name … and thus my own contribution to the omics word game began).  Alas somehow the title of our paper became “Gatrogenomic delights” a movable feast” since we were writing about the E. coli and H. pylori genomes, so I added yet another omics term at the same time.  In the paper I showed how phylogenetic analysis of the MutS family of proteins could help in interpreting one of the findings in the H. pylori genome paper:

In this paper we showed why blast searches were not ideal for inferring relationships among sequences (because blast measures similarity NOT evolutionary history per se).  A bit annoyed still that other papers then sort of claimed they were the first to show blast was not ideal for inferring evolutionary relatedness, but whatever. This still did not fully describe the phylogeny driven approach that I was working on so I then wrote up an outline of this approach for a paper in Genome Research: Phylogenomics: Improving Functional Prediction for Uncharacterized Genes by Evolutionary Analysis.  This paper really laid out the idea in more detail:

It also gave detailed examples of how similarity searches could be misleading and how phylogenetic analysis should in principle be better.

I note – I am very very proud of this paper.  But it did not do a lot of things.  Really it was about laying out a concept of using tools from phylogenetics in functional prediction.  But it did not provide software for example.  I later developed some of my own scripts for doing this when I was at TIGR but really the software for phylogeny driven functional predictions would come later from others like Kimmen Sjolander, Sean Eddy, and Steven Brenner.  Each method laid out in these tools and in other papers had its own flavors and I continued to explore various approaches and applications to phylogeny driven functional prediction.  Examples of my subsequent work are listed below (with links to the Mendeley pages for these papers):

Plus we (at TIGR) used phylogenetic analysis as a tool in annotation of many many genomes as well as metagenomes.

Anyway, enough of history for a bit.  What is interesting about this new paper is that they take a slightly different approach to phylogeny driven functional prediction in that they make use of Gene Ontology functional annotations as their key parameter to trace on evolutionary trees.  They lay out the differences in their method quite well in the introduction:

Our general approach is similar to the ‘phylogenomic’ method proposed by Eisen [6] and further developed into a probabilistic form by Engelhardt et al. [7], but with important differences. Eisen proposed a conceptual approach for predicting protein function using a phylogenetic tree together with available experimental knowledge of proteins. The original approach relied on manual curation to identify gene duplication events and to find and assimilate the literature for characterized members of the family. Engelhardt et al. used automated reconciliation with the species tree [8] to identify gene duplication events, and experimental GO terms (MF only) to capture the experimental literature. Using this information, they defined a probabilistic model of evolution of MF involving transitions between different molecular functions.

From these previous studies, we adopt the basic approach of function evolution through a phylogenetic tree and the use of GO annotations to represent function. However, unlike these other phylogenomic methods, we represent the evolution in terms of discrete gain and loss events. In Eisen’s original model, an annotation does not necessarily represent a gain of function (it could have been inherited from an earlier ancestor), and losses are not explicitly annotated. The transition-based model of Engelhardt et al. assumes replacement of one function by another (gain of one function coupled to the loss of another), and does not capture uncoupled events, which is particularly important for BP annotations and cases where a protein has multiple molecular functions (see examples below). In addition, we make no a priori assumptions about conservation of function within versus between orthologous groups, or about the relationship between evolutionary distance and functional conservation (as the distance may not necessarily reflect every given function). While, as described below, gene duplication events and relatively long tree branches are important clues for curators to locate functional divergence (gain and/or loss), in our paradigm an ancestral function can be inherited by both descendants following a duplication (resulting in paralogs with the same function) or gained/lost by one descendant following a speciation event (resulting in orthologs with different functions). Evolution of each function is evaluated on a case-by-case basis, using many different sources of information about a given protein family

I note – Paul Thomas, one of the authors here has also been developing phylogeny driven functional prediction methods for many years and has done some cool things previously.  This new approach seems novel and useful and their paper is worth looking at.  I like too that they focus on MutS homologs for some of their examples:

Anyway – their paper is worth a read and some of their software tools may be of use including PAINT: http://sourceforge.net/projects/pantherdb/ and http://pantree.org

Good to see continuous developments in phylogeny driven functional predictions.  If you want to learn more – check out the Mendeley Group I have created:

http://www.mendeley.com/groups/1190191/_/widget/29/5/

And please contribute to it. Below are some previous posts of mine of possible interest:

I think that I shall never see – metagenomic analysis as lovely as a tree #PhylogenyRules #PLoSOne

ResearchBlogging.org

Figure 2. Phylogenetic tree linking
metagenomic sequences from 31 gene
families  along an oceanic depth gradient
 at the HOT ALOHA site

I am a co-author on a new paper that came out in PLoS One yesterday.  The paper is PLoS ONE: The Phylogenetic Diversity of Metagenomes and the full citation is Kembel SW, Eisen JA, Pollard KS, Green JL (2011) The Phylogenetic Diversity of Metagenomes. PLoS ONE 6(8): e23214. doi:10.1371/journal.pone.0023214.

The first author is Steven Kembel, a brilliant post doc at the University of Oregon.  You can follow him on twitter here. This paper is a product of the “iSEEM” “integrating statistical, ecological and evolutionary approaches to metagenomics” collaboration between my lab and the labs of Jessica Green at U. Oregon and Katie Pollard at UCSF.  For more on iSEEM see http://iseem.org.  iSEEM was supported by the Gordon and Betty Moore Foundation.

Anyway – the paper focuses on developing and using a new method for assessing the phylogenetic diversity of microbes via in samples via analysis of metagenomic data.  Phylogenetic diversity (aka PD) is measured by building evolutionary trees and summing up the total length of branches in such trees.  It is an important diversity metric and is complementary to metrics such as “species richness” which is a measure of the number of species in a sample. When one counts species in a sample, one ends up ignoring the evolutionary distances between species and thus one may get an incomplete picture of the diversity of organisms in a sample simply by counting species.  For example, a sample that contains 500 different species in the genus Escherichia would have the same “richness” as a sample that contained one representative of each of 500 different Orders of bacteria.  For many purposes it is useful to know whether one has a phylogenetically diverse sample or not.  (And of course, if one just focuses on species richness it is also important to not simply ignore some set of organisms in the samples as has sort of been done in a recent paper estimating the total species richness on the planet).  But that is not the point here – the point here is that counting species, even if done correctly, can give an incomplete picture of the diversity of organisms in sample.

For many years researchers have been attempting to measure phylogenetic diversity of various organisms in various samples.  And to do this one needs an evolutionary tree of the organisms in order to then measure branch length in the tree.  There is actually a relatively rich history of researchers attempting to look at PD in studies of microbes – especially in cases where one has access to a rRNA tree for the organisms / samples in question.  Examples of past work on this include:

What we wanted to do here was use metagenomic data to assess phylogenetic diversity of samples.  And in particular we wanted to do this with genes other than rRNA genes (e.g., protein coding genes).  There were multiple challenges in being able to do this (e.g., see a blog post I made about this issue a few years ago asking for community input).  Fortunately, Kembel has worked previously on multiple issues relating to phylogenetic diversity and phylogenetic ecology and his work led to this paper.

I note, as an aside, I have created a Mendeley group focusing on phylogenetic analysis of metagenomes and have added a diversity of papers to the collection:

http://www.mendeley.com/groups/1152921/_/widget/29/2/

In the paper Steve basically started with some of the notions and the code from AMPHORA which was designed by Martin Wu (when he was in my lab).  AMPHORA automatically infers phylogenetic trees of a set of 31 protein coding genes – and it can do this from genomic or metagenomic data. 
AMPHORA was designed to build phylogenetic trees of metagenomic sequences individually – in order to classify reads from samples to infer from what organism they likely came
But that is not what Steven wanted to do here.  What he wanted to do was infer phylogenetic trees from metagenomic samples where ALL the organisms in the sample were included in the same tree.  This was / is challenging for many reasons and this is what I had written the blog post about previously.  One issue we had was the fact that sequences might not overlap with each other and thus including them in a single phylogenetic tree together was complicated.  
From my earlier post:
The challenge with this is really two things. First, we want to analyze just the reads themselves (i.e., we do not want to use assemblies you can make from this type of data). Second, and more importantly, we want to include in our analysis sequence reads that only cover small, not necessarily overlapping regions of the “full length” sequence alignments for the family. 

The alignment would look something like

    sequence 1 XXXXXXXXXXXXXXXXXXXXXXXXXXXXXXXXXX
    fragment 1 XXXXXXXXX————————-
    sequence 2 XXXXXXXXXXXXXXXXXXXXXXXXXXXXXXXXXX
    fragment 2 ———XXXXXXXXXXXX————-
    fragment 3 ———————XXXXXXXXXXXXX
    fragment 4 —-XXXXXXXXXXXXXXXXXX————
    sequence 3 XXXXXXXXXXXXXXXXXXXXXXXXXXXXXXXXXX
    sequence 4 XXXXXXXXXXXXXXXXXXXXXXXXXXXXXXXXXX
    sequence 5 XXXXXXXXXXXXXXXXXXXXXXXXXXXXXXXXXX
    fragment 5 ———————–XXXXXXXXXXX- 
    where Xs are the regions covered by the sequences/fragments (could be DNA or amino acids)


We want to build trees from these alignments with the hope of using them to learn lots of cool things about the evolution of the fragments and the species from which they come. I can provide more information but really the key part for the phylogenetics here is the nature of the alignment.

In the past, I have decided to constrain my analyses to NOT deal with this type of alignments. I have either analyzed each fragment on its own or we have built a multiple alignment but only inlcuded fragments that cover more than 3/4 of the full length sequence and thus the matrix is much more filled out. Such an alignment would look like this

    sequence 1 XXXXXXXXXXXXXXXXXXXXXXXXXXXXXXXXXX
    fragment 1 XXXXXXXXXXXXXXXXXXXXXXXXXXX——-
    sequence 2 XXXXXXXXXXXXXXXXXXXXXXXXXXXXXXXXXX
    fragment 2 –XXXXXXXXXXXXXXXXXXXXXXXX——–
    fragment 3 —–XXXXXXXXXXXXXXXXXXXXXXXXXXXXX
    fragment 4 —-XXXXXXXXXXXXXXXXXXXXXXXXXXXX–
    sequence 3 XXXXXXXXXXXXXXXXXXXXXXXXXXXXXXXXXX
    sequence 4 XXXXXXXXXXXXXXXXXXXXXXXXXXXXXXXXXX
    sequence 5 XXXXXXXXXXXXXXXXXXXXXXXXXXXXXXXXXX
    fragment 5 –XXXXXXXXXXXXXXXXXXXXXXXXXXXXXXX- 

But we really want to include the smaller fragments in our analysis. And we are just not certain how to best do this. We know LOTs of people out there think of similar problems in terms of sparse matrices, supermatrices, supertrees, EST data, etc. And we have ideas about how to do this and are asking around by email some phylogenetics gurus we know. But I thought it might be fun to have the discussion on a blog rather than by email.

So again, how might one best build phylogenetic trees from data that looks like this?

    sequence 1 XXXXXXXXXXXXXXXXXXXXXXXXXXXXXXXXXX
    fragment 1 XXXXXXXXX————————-
    sequence 2 XXXXXXXXXXXXXXXXXXXXXXXXXXXXXXXXXX
    fragment 2 ———XXXXXXXXXXXX————-
    fragment 3 ———————XXXXXXXXXXXXX
    fragment 4 —-XXXXXXXXXXXXXXXXXX————
    sequence 3 XXXXXXXXXXXXXXXXXXXXXXXXXXXXXXXXXX
    sequence 4 XXXXXXXXXXXXXXXXXXXXXXXXXXXXXXXXXX
    sequence 5 XXXXXXXXXXXXXXXXXXXXXXXXXXXXXXXXXX
    fragment 5 ———————–XXXXXXXXXXX


And from these trees we want to place each fragment relative to (1) the full length sequences and (2) to each other if possible. We also, of course, want branch lengths to reflect some sort of amount of evolution and thus do not just want a cladogram.

So what Steven decided to do in the end was create a method that took all of the AMPHORA markers and concatenated them together into a single mega alignment and then built a reference tree of this mega alignment from available genomes.  Then he searched for matches to any of these genes in metagenomic data and built a tree for each sequence that placed it relative to the reference data.  
Figure 1. Conceptual overview of approach to infer phylogenetic relationships among sequences from metagenomic data sets.
This pipeline allowed him to place many sequences from metagenomic samples onto a single tree such as this one:

Phylogenetic tree linking metagenomic sequences from 31 gene
families along an oceanic depth gradient at the HOT ALOHA site 

And from that he could calculate PD for metagenomic samples.  We then used the PD calculations to comparate and contrast PD with other information in particular from the HOT ALOHA metagenomic data set of Ed Delong, Steve Karl and others.

Figure 3. Taxonomic diversity and standardized
phylogenetic diversity versus depth in environmental
samples along an oceanic depth gradient at the HOT ALOHA site.

For more detail on what we did from there on – read the paper.  It is open access so all can see it / download it / play with it / whatever.  But rather than blather on and on as usual I thought I would email Steve some questions and then post his answers.  These are below:

Can you provide any background to how this work got started and why you ended up doing it?

This work got started as a collaboration between the Eisen, Green, and Pollard labs as part of the iSEEM project (“Integrating Statistical Evolutionary & Ecological Approaches to Metagenomics”), which was funded by the Moore Foundation to figure out ways to address ecological and evolutionary questions using metagenomic data. I had a background in using phylogenetic and evolutionary information to understand ecological communities, and one of the things I wanted to do at iSEEM was to try to think about ways that we could apply methods from ecophylogenetics or phylogenetic community ecology to metagenomic data sets. In conversations among the co-authors, we realized that if we could build phylogenetic hypotheses for organisms based on metagenomic data, we could apply a huge body of ecological and evolutionary theory and use these data sets to improve our understanding of microbial communities and their dynamics.

2. How did you end up working on microbes with your background in larger organisms?

The transition from working on macro-organisms to working on microbes actually wasn’t that big of a leap, since my research has generally been question driven rather than study-system or study-organism driven. My previous research involved using phylogenetic information to better understand community assembly in plants and animals. The increasing availability of phylogenetic information for entire communities of plants and animals drove the development of the field of ‘ecophylogenetics’, and it always seeemed to me that microbes would be the ideal system for this type of approach due to the greater availability of sequence data and phylogenetic information for microbes. Also, the development of high-throughput  sequencing methods meant that the size of microbial community data sets would quickly become really, really large… the prospect of working on data sets with hundreds of millions of observations was really exciting. As my first postdoc was wrapping up, I collaborated on a study looking at phylogenetic diversity of the rhizobacterial symbionts of plant roots that got me interested in microbial ecology. Right around that time I came across the opportunity to work on the iSEEM project, so it seemed like the perfect opportunity to try a new study system.

Having studied the community ecology of both micro- and macro-organisms, I find it interesting that the fields of microbial and non-microbial phylogenetic community ecology have been fairly insulated from one another until recently. For example, the two fields independently developed phylogenetic approaches to community ecology, each field having its own set of favored statistical methods and software packages, with almost no cross-citation, despite addressing very similar questions. In microbiology the emphasis on phylogenetic diversity measures seems to have been driven by the empirical difficulty of defining microbial ‘species’ and other taxonomic units that macro-organismal ecologists are comfortable with, as well as the availability of phylogenetic and sequence data for microbes. Conversely, for macroorganisms the field of ecophylogenetics was driven by a desire to apply a large body of theory on the links between ecological and evolutionary dynamics to empirical data sets, but was relatively data poor in terms of phylogenetic information about individual species.

3. What was the biggest challenge in this work?

For me the biggest challenge was convincing myself and others that we could infer anything about organismal phylogenies from metagenomic data.  People had built phylogenies for individual genes from metagenomic data sets, but there was a lot of skepticism about how and whether it would be possible to infer a phylogeny for multiple genes given the short, non-overlapping nature of metagenomic sequences. A post on your blog provided a lot of useful feedback. In the end this challenge was overcome both through the availability of software packages for placement of short sequences onto reference phylogenies, as well as simulation and bootstrap analyses to make sure that the results we were finding were robust.

4. Any additional things left out of the paper that you would like to mention here? Other acknowledgements?  Annoyances?

There were a number of people involved in the iSEEM project, including Samantha Risenfeld and Aaron Darling, who did simulations that were very helpful in figuring out when and whether we could make inferences about phylogenetic relationships among metagenomic reads.

Our paper makes use of a large number of open-source software packages and I’d like to thank the people who made their code available for re-use in this way. In particular the short sequence placement methods implemented in packages like RAxML and pplacer made this study possible.

5. What (in general) are your current and future plans?

Right now I’m working at the Biology & the Built Environment Center on a number of projects studying the phylogenetic and functional diversity of microbes in indoor environments, trying to understand the interaction between architectural design and microbial diversity indoors, and the role indoor microbes play in human health and well being. I am still interseted in plant biology, and I have an ongoing project looking at the diversity and function of microbial communities on plant leaves (the ‘phyllosphere’) in tropical and temperate forests.

Kembel, S., Eisen, J., Pollard, K., & Green, J. (2011). The Phylogenetic Diversity of Metagenomes PLoS ONE, 6 (8) DOI: 10.1371/journal.pone.0023214

Twisted tree of life award: @Discovermag for article on Lynne Margulis

Well, if you can, for a minute, ignore that fact that in Discover Interview: Lynn Margulis Says She’s Not Controversial, She’s Right | Evolution | DISCOVER Magazine Discover Magazine in essence is promoting some of the refuted ideas Lynne Margulis has about HIV. Sure they hint in part that they think she is over the top but they also give her a soapbox to spout some of her latest absurdities on HIV and such. I would suggest you don’t even read the main part of the Discover article. Just read Tara Smith’s discussion of it: Margulis does it again : Aetiology. Margulis should not be given such prominence in a magazine like Discover. But that is not what I am hear to write about. I am hear to point out that Discover also sets up a red herring for Margulis. In the beginning of the article, it is written:

“A conversation with Lynn Margulis is an effective way to change the way you think about life. Not just your life. All life. Scientists today recognize five groups of life: bacteria, protoctists (amoebas, seaweed), fungi (yeast, mold, mushrooms), plants, and animals. Margulis, a self-described “evolutionist,” makes a convincing case that there are really just two groups, bacteria and everything else.”

Seriously? Scientists today do not recognize five groups. Scientists today have moved past that to recognize and/or argue about bacteria, archaea and eukaryotes – the three domains of life. These three groups were first proposed in 1977 by Carl Woese and colleagues. Did Discover somehow miss the last 34 years of science? WTF? For setting up such an evolutionary red herring in this painful interview with Lynne Margulis, I am giving Discover Mag my coveted “Twisted tree of life award“. Past winners are:

Summary of #iEVOBIO Day 2, #phylogenetics #informatics #opensource #biodiversity #evolution

This is a continuation of notes on iEVOBIO meeting.  Much of this comes from twitter.  Additional comments will be posted over the next few days.  See notes on Day 1 here. Note – thanks to the people who answered my query on twitter about how to remove spurious html code from pages – I wrote this post a few days ago but somehow the copying and pasting I did from twitter broke blogger with some weird html.  I ended up using Zubrag which was suggested by brendanwlocke.

Day 2. Beginning.

Since I was leaving that PM I could not borrow a hotel bike and bike over again.  So I walked from the hotel, along the river 2 or so miles, after getting coffee.  I got to the meeting a bit late and thus missed much of the opening Keynote, which was a bummer since it seemed very good.  But I find if I do not get some exercise every day at a meeting I go crazy so it was worth it.  Here are some notes on Day 2.

Day 2. Part 1. Keynote

Alas, I missed much of the keynote.  But what I caught was good.  Here are some notes, mostly from twitter. And also see Rob G’s slides below

Rob Guralnick: Biodiversity Discovery and Documentation in the Information and Attention Age

    Day 2. Part 2. Short talks.

    Day 2. Part 3. Lunch

    Went to lunch with a small group to the People’s Sandwich of Portland.  Took the light rail over the river.  Portland has some really nice features – like free light rail in the city.

    Day 2. Part 4. Lightning Talks

    Day 2. Part 5. Birds of a feather


    Then there were breakout sessions which were called “Birds of a feather”  I went to one discussing open access and fair use issues. 

    Day 2. Part 6. Wrap up and other general information

    And then I had to go home.  The meeting wrapped up as I was leaving. Here are some ending tweets:

    Some other general info tweets:

    Post meeting posts and blogs

    More coverage of the GEBA "Phylogeny Driven Genomic Encyclopedia"

    Just a quick note here to post some links to additional stories about my new paper on “A phylogeny driven genomic encyclopedia of bacteria and archaea” which was published last week in Nature (with a Creative Commons license – which is rare in Nature but is what they use for genome sequencing papers).

    Carl Zimmer has an article today in the New York Times “Scientists Start a Genomic Catalog of Earth’s Abundant Microbes”  about the paper and the project.  In the article he interviews me and Hans-Peter Klenk, who was a co-author and led the culturing part of the project.  A few things to note about this:

    • It is rare to have archaea mentioned in the New York Times.
    • There is a tree that goes along with the article which is a modified version of the tree we had in our paper.  I think theirs is very nice. Kudos to their artist
    • There is a quote by Norm Pace generally supportive of the project 
    • The article mentions the JGI Adopt a Microbe program and even has a shout out to Malcolm Campbell at Davidson College and his recent PLoS One paper where they discuss results from a project where they took one of the genomes from our project and used it as part of a course on genome annotation/analysis. 

    For some of the story behind the paper see my recent blog post “Story Behind the Nature Paper on ‘A phylogeny driven genomic encyclopedia of bacteria & archaea’ #genomics #evolution

    Other discussions worth checking out

    Also see

    ResearchBlogging.org

    Wu, D., Hugenholtz, P., Mavromatis, K., Pukall, R., Dalin, E., Ivanova, N., Kunin, V., Goodwin, L., Wu, M., Tindall, B., Hooper, S., Pati, A., Lykidis, A., Spring, S., Anderson, I., D’haeseleer, P., Zemla, A., Singer, M., Lapidus, A., Nolan, M., Copeland, A., Han, C., Chen, F., Cheng, J., Lucas, S., Kerfeld, C., Lang, E., Gronow, S., Chain, P., Bruce, D., Rubin, E., Kyrpides, N., Klenk, H., & Eisen, J. (2009). A phylogeny-driven genomic encyclopaedia of Bacteria and Archaea Nature, 462 (7276), 1056-1060 DOI: 10.1038/nature08656

    Bakke, P., Carney, N., DeLoache, W., Gearing, M., Ingvorsen, K., Lotz, M., McNair, J., Penumetcha, P., Simpson, S., Voss, L., Win, M., Heyer, L., & Campbell, A. (2009). Evaluation of Three Automated Genome Annotations for Halorhabdus utahensis PLoS ONE, 4 (7) DOI: 10.1371/journal.pone.0006291